Fig. 7
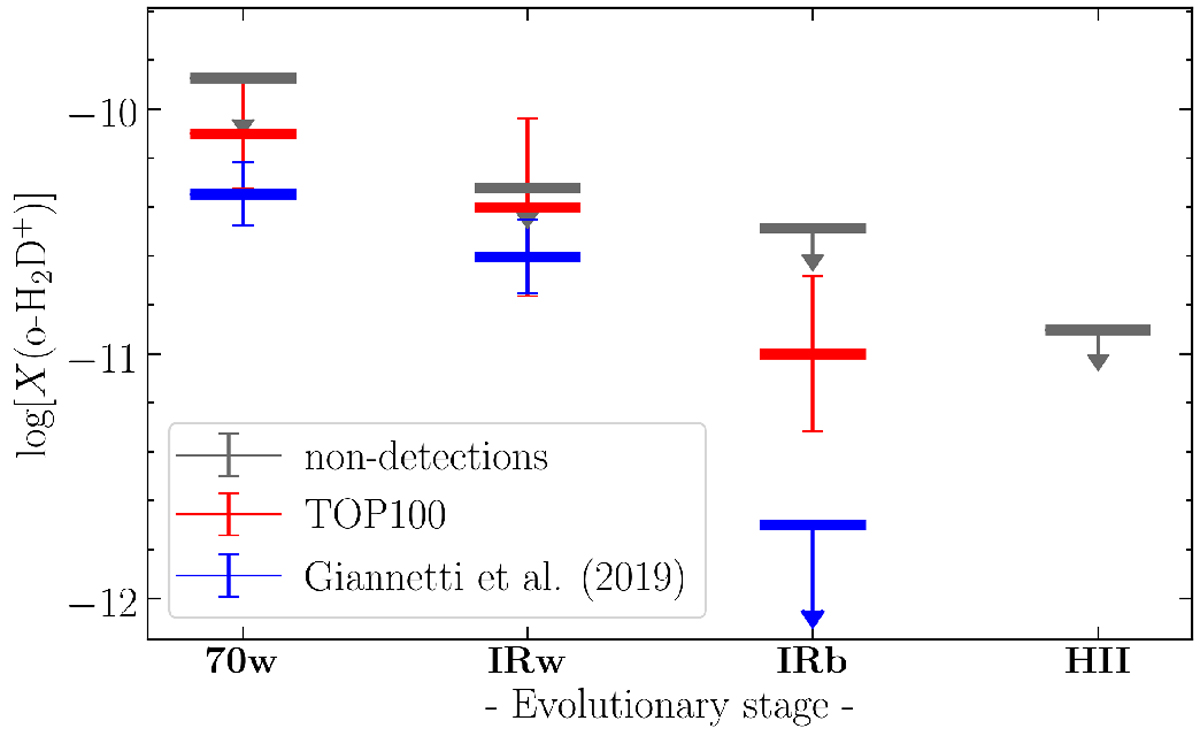
Average X(o-H2D+) abundance as a function of the evolutionary classes in our sample. Blue markers indicate the recent estimates of Giannetti et al. (2019), while the red and grey ones indicate the mean of detection and the median X(o-H2D+) derived from detection limits, respectively. Uncertainties are derived as mean and median as well, considering the errors on the individual source.
Current usage metrics show cumulative count of Article Views (full-text article views including HTML views, PDF and ePub downloads, according to the available data) and Abstracts Views on Vision4Press platform.
Data correspond to usage on the plateform after 2015. The current usage metrics is available 48-96 hours after online publication and is updated daily on week days.
Initial download of the metrics may take a while.