Fig. 6
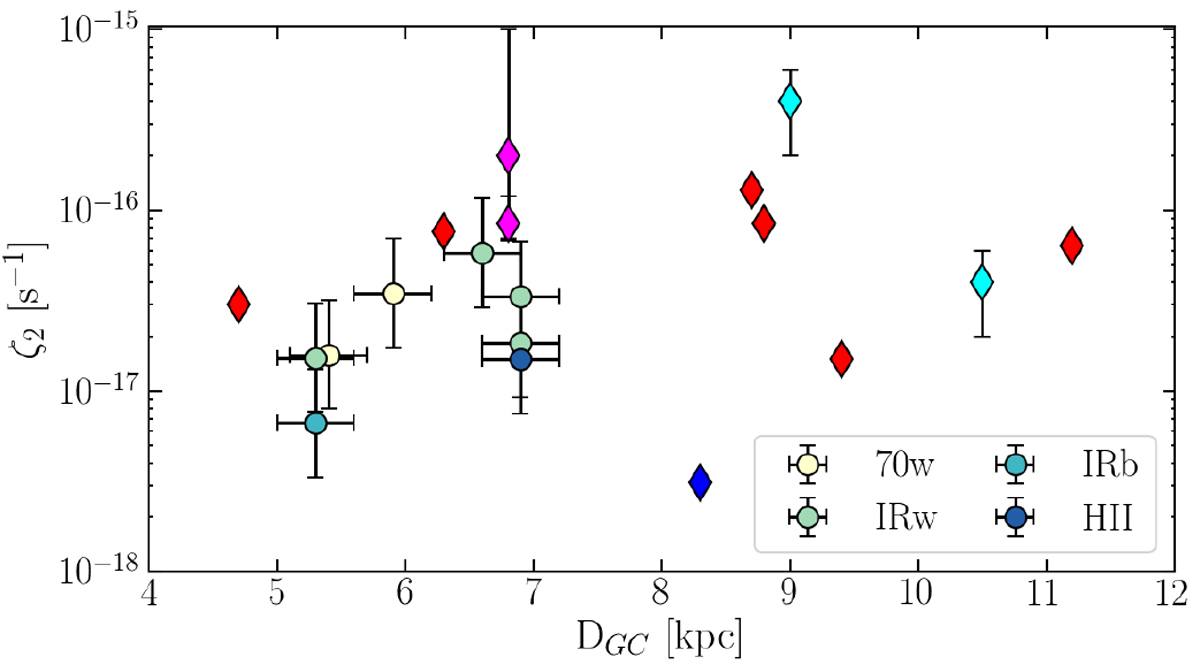
ζ2 variation as a function of DGC for the high-mass cores shown in Fig. 5. Circles refer to our estimates of ζ2 in high-mass star-forming regions in different evolutionary stages (see legend). The same colour-coding as in Fig. 5 is assumed for diamonds. The galactocentric radii are taken from Table 1 (circles), van der Tak & van Dishoeck (2000) (red), Morales Ortiz et al. 2014 (magenta), Winkel et al. 2017 (blue), Spina et al. 2017, and Yan et al. 2019 (cyan). DCG are scaled assuming a distance to the Galactic Center of 8.35 kpc.
Current usage metrics show cumulative count of Article Views (full-text article views including HTML views, PDF and ePub downloads, according to the available data) and Abstracts Views on Vision4Press platform.
Data correspond to usage on the plateform after 2015. The current usage metrics is available 48-96 hours after online publication and is updated daily on week days.
Initial download of the metrics may take a while.