Fig. 5
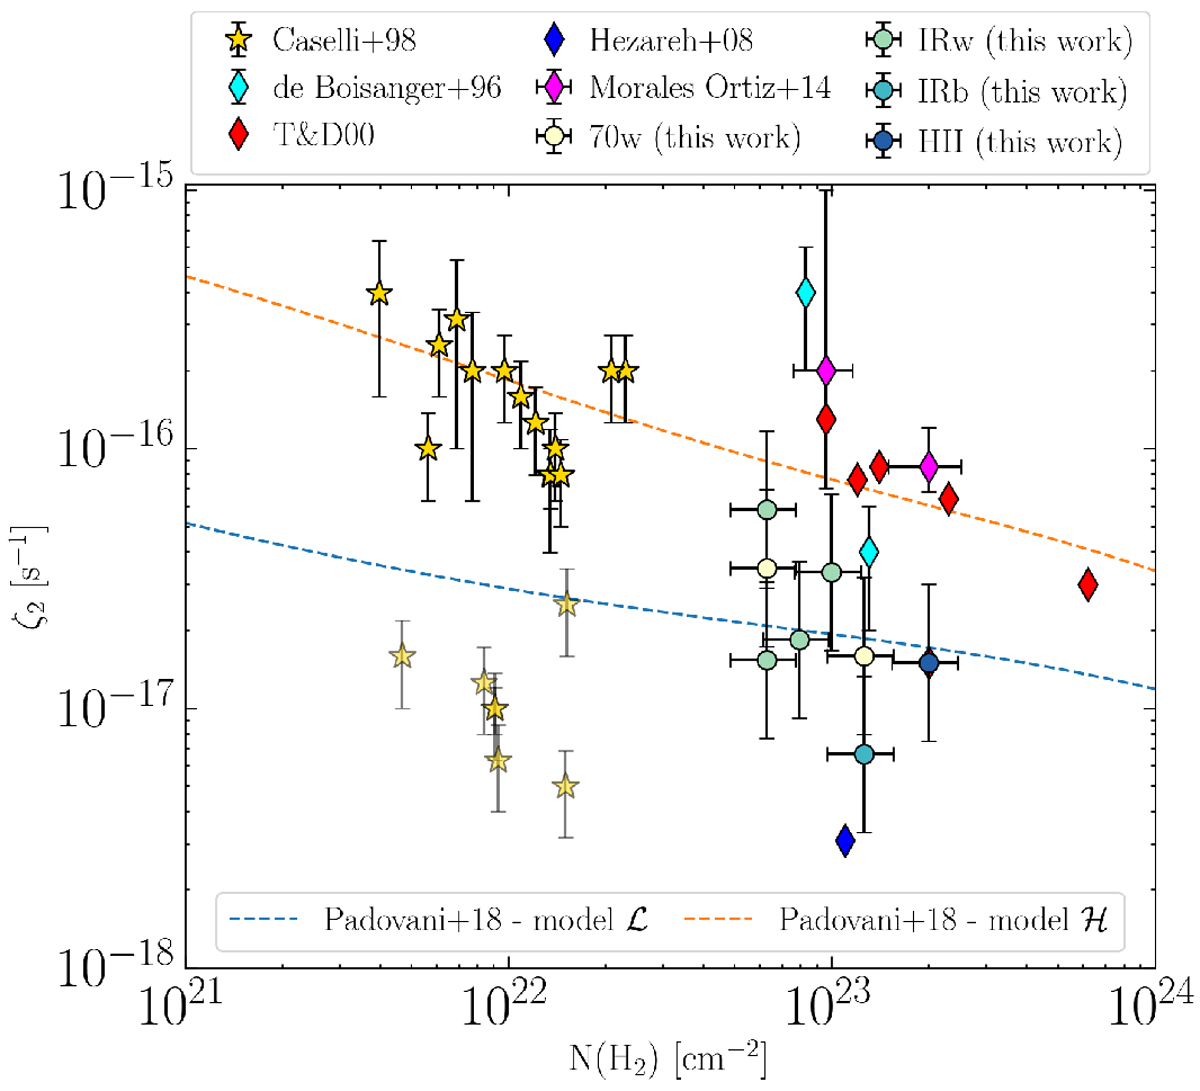
ζ2 variation as a function of N(H2). Circles refer to our estimates of ζ2 in high-mass star-forming regions in different evolutionary stages (same colour-coding as in Fig. 4). Yellow stars show the estimates of Caselli et al. (1998) for a large sample of low-mass cores, while diamonds represent high-mass cores (cyan from de Boisanger et al. 1996; red from van der Tak & van Dishoeck 2000 (T&D00) forζ2 estimates and from van der Tak et al. 2000 and Doty et al. 2002 for N(H2) values; blue from Hezareh et al. 2008; magenta from Morales Ortiz et al. 2014). Dashed lines show the models discussed in Padovani et al. (2018) assuming different slopes for the CR proton spectrum. Different levels of transparency have been used to separate what we considered outliers (pale color) from the other estimates (full colour). This plot was readapted from Padovani et al. (2009).
Current usage metrics show cumulative count of Article Views (full-text article views including HTML views, PDF and ePub downloads, according to the available data) and Abstracts Views on Vision4Press platform.
Data correspond to usage on the plateform after 2015. The current usage metrics is available 48-96 hours after online publication and is updated daily on week days.
Initial download of the metrics may take a while.