Fig. 4
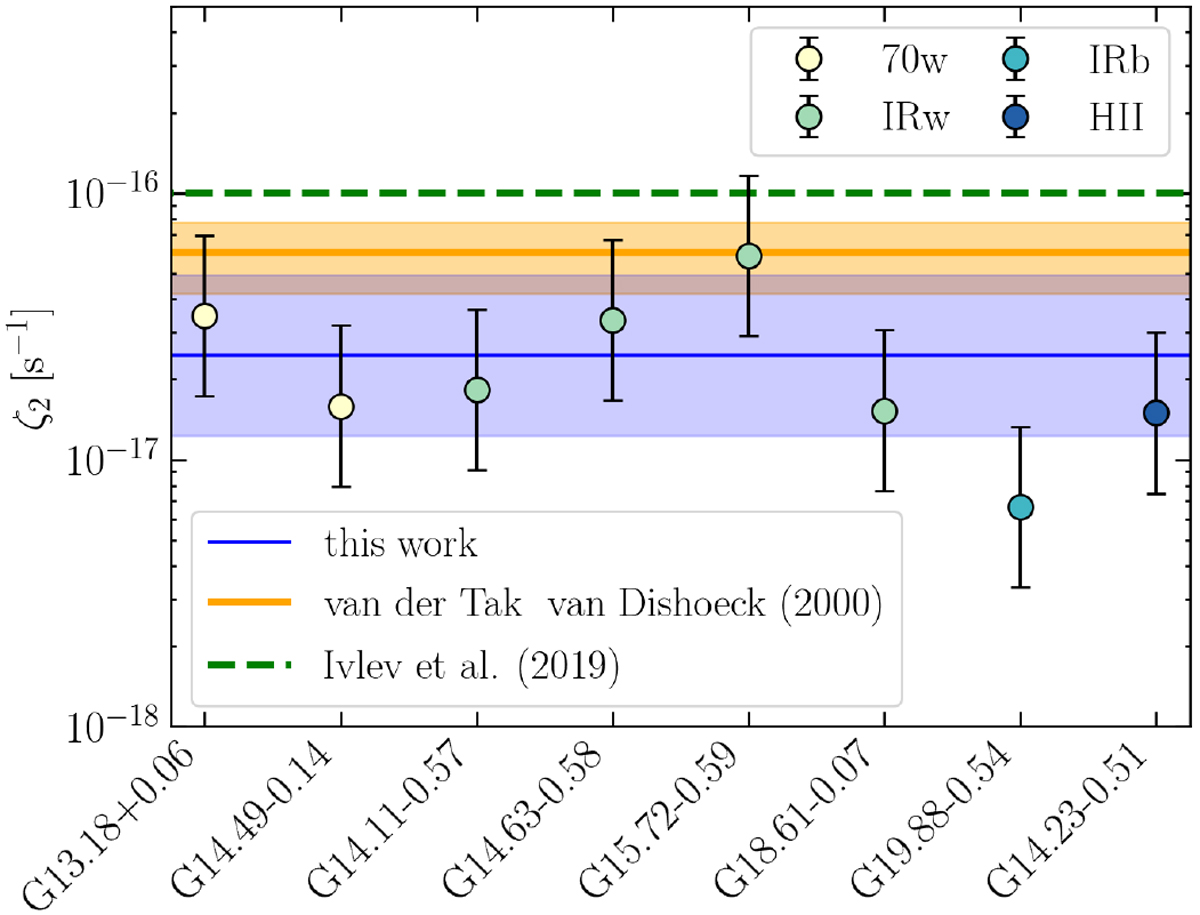
Estimates of the CRIR of hydrogen molecules, ζ2, derived for a sub-sample of sources for which H2D+, DCO+, H13 CO+, and C17 O observationsare available, and assuming ℓ = Reff in Eq. (5), representing our reference case (dots). The sources are arranged from left to right following their evolutionaryphase (bottom left legend). The bars associated with each point represent the variability of our results with ℓ (i.e. ℓ = 0.5Reff and ℓ =2Reff for the upper and lower limit, respectively). The blue line is our mean value for ζ2 for the reference case, while the blue shaded area is its variability with ℓ. The orange line and shaded area represents the estimates of van der Tak & van Dishoeck (2000), obtained by converting the CRIR for hydrogen atom, ζH, via ζ2 = 2.3 × ζH. The green line is the recent upper limit for L1544 reported by Ivlev et al. (2019).
Current usage metrics show cumulative count of Article Views (full-text article views including HTML views, PDF and ePub downloads, according to the available data) and Abstracts Views on Vision4Press platform.
Data correspond to usage on the plateform after 2015. The current usage metrics is available 48-96 hours after online publication and is updated daily on week days.
Initial download of the metrics may take a while.