Fig. 3
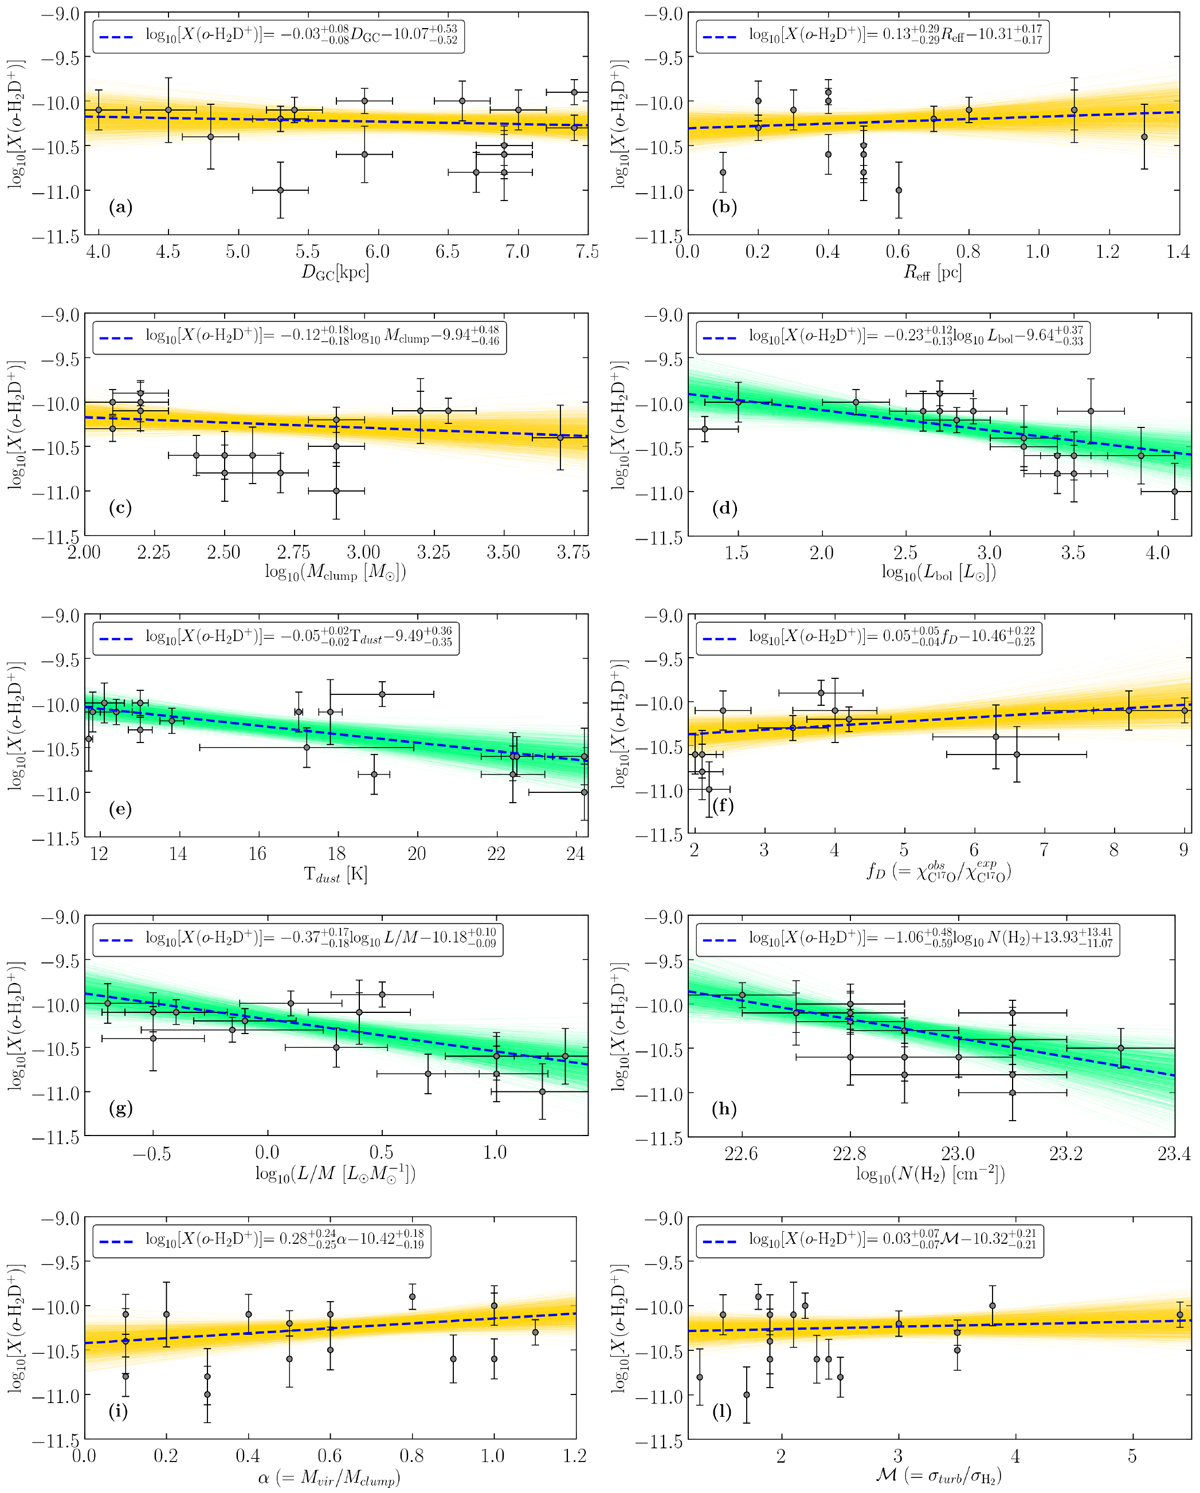
Collection of the different correlations between X(o-H2D+) and the quantities summarised in Tables 1 and 3. Grey dots are associated with each source, while uncertainties are shown as black bars. Orange and green shaded regions are the 3σ results of theMCMC linear fit respectively for the unreliable (![]() ) and reliable (
) and reliable (![]() ) correlations we found for the whole sample. Blue dashed lines represent the fiducial model (i.e. with the highest likelihood among the ones explored by MCMC). The fit parameters are shown in the caption of each correlation. All plots are in log-linear scale, except for panels c, d, g, and h where the axes are set in log-log scale.
) correlations we found for the whole sample. Blue dashed lines represent the fiducial model (i.e. with the highest likelihood among the ones explored by MCMC). The fit parameters are shown in the caption of each correlation. All plots are in log-linear scale, except for panels c, d, g, and h where the axes are set in log-log scale.
Current usage metrics show cumulative count of Article Views (full-text article views including HTML views, PDF and ePub downloads, according to the available data) and Abstracts Views on Vision4Press platform.
Data correspond to usage on the plateform after 2015. The current usage metrics is available 48-96 hours after online publication and is updated daily on week days.
Initial download of the metrics may take a while.