Fig. 1
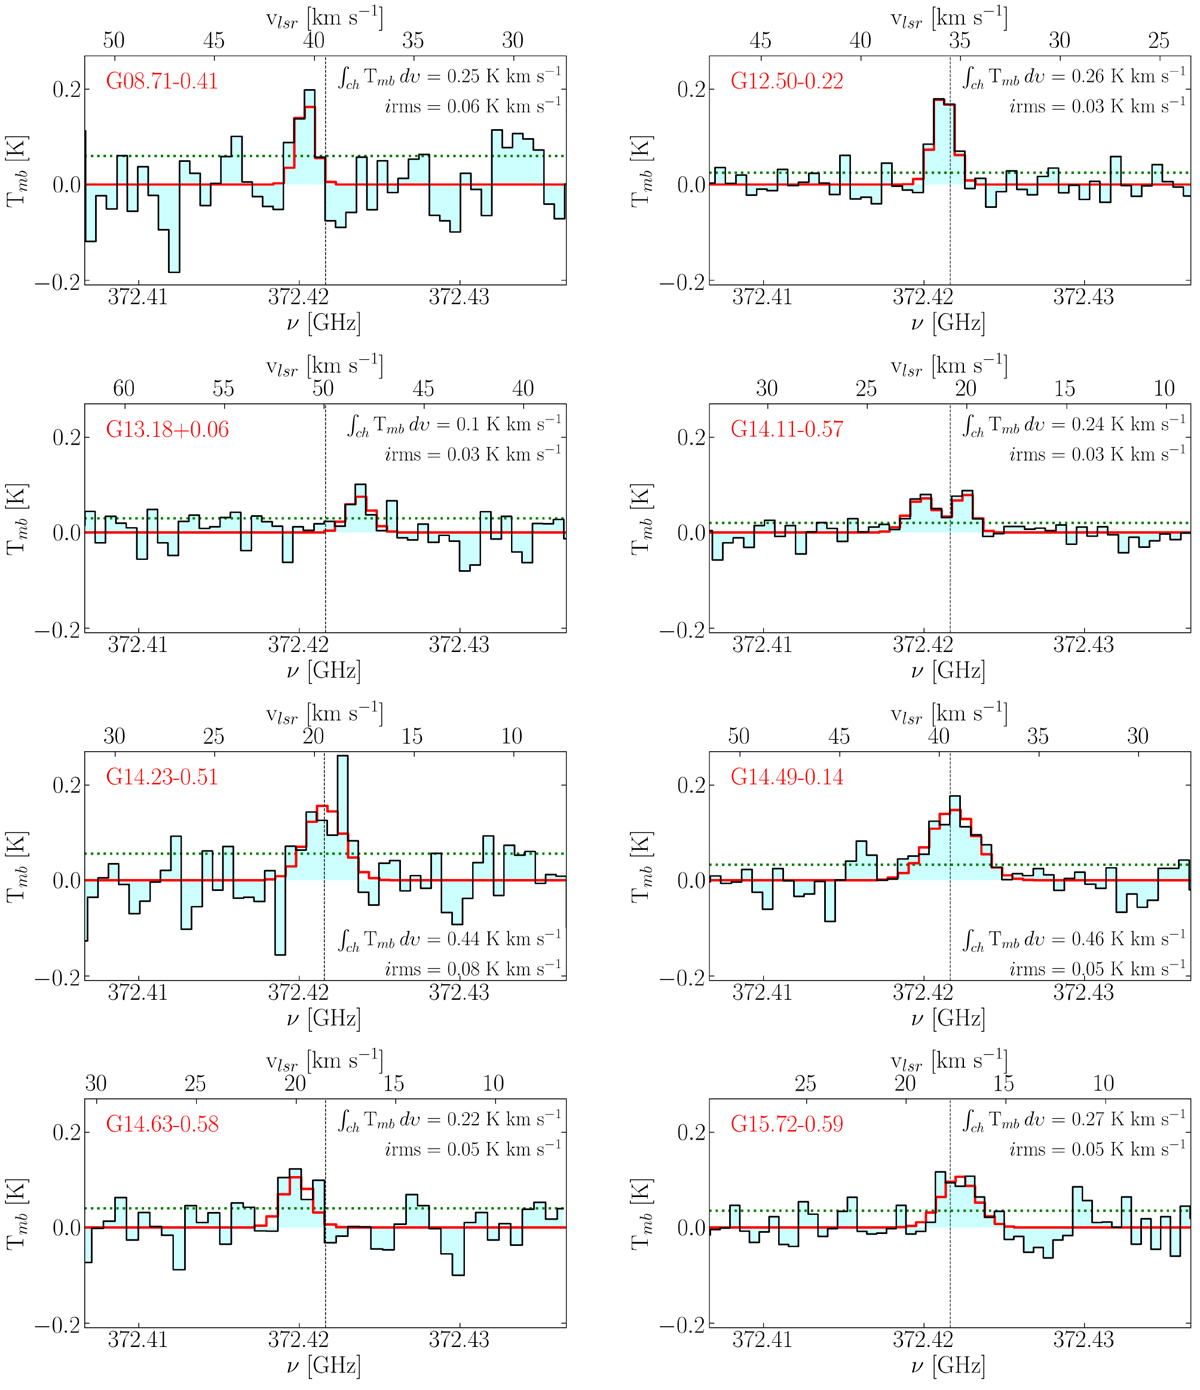
o-H2D+ spectra for half the sources of our sample (cyan). In each panel, the source name is shown on the left in red, while the integrated main-beam temperature, ∫chTmb dυ, and rms (irms) are on the right in black. The green dotted line represents the 1σ noise levels in Tmb. The frequency and velocity axes are reported and cut around the line, while the intensity axis is fixed to the highest Tmb detected (observed in G14.23–0.51). The black dashed lines indicate the vlsr of each source derived from the C17O J = 3–2 and the NH3 (1, 1) lines (see Table 1). The model obtained with MCWeed is superimposed in red.
Current usage metrics show cumulative count of Article Views (full-text article views including HTML views, PDF and ePub downloads, according to the available data) and Abstracts Views on Vision4Press platform.
Data correspond to usage on the plateform after 2015. The current usage metrics is available 48-96 hours after online publication and is updated daily on week days.
Initial download of the metrics may take a while.