Free Access
Fig. 9
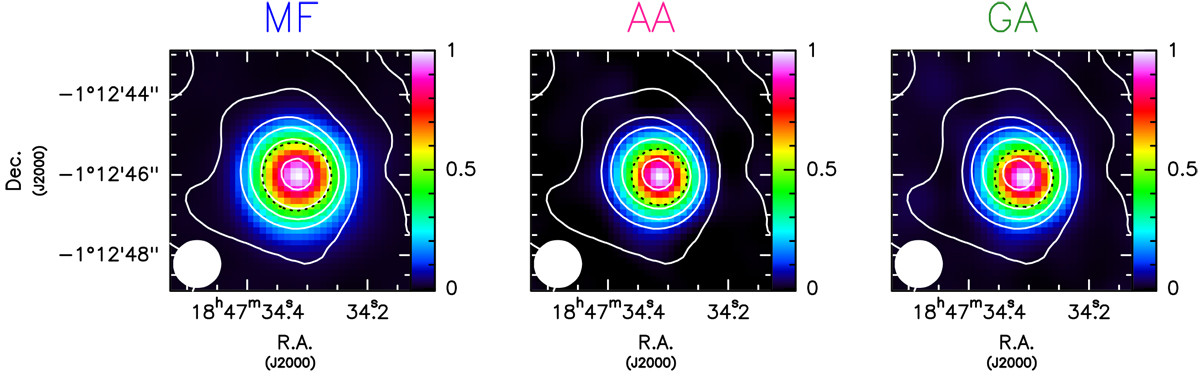
Mean map for each molecule, obtained from the average of the 8 maps at different Eu in Fig. 8, rescaled to a peak of intensity 1 before averaging. The black dashed line is the contour where the emissionreaches the half the peak intensity.
Current usage metrics show cumulative count of Article Views (full-text article views including HTML views, PDF and ePub downloads, according to the available data) and Abstracts Views on Vision4Press platform.
Data correspond to usage on the plateform after 2015. The current usage metrics is available 48-96 hours after online publication and is updated daily on week days.
Initial download of the metrics may take a while.