Fig. 2
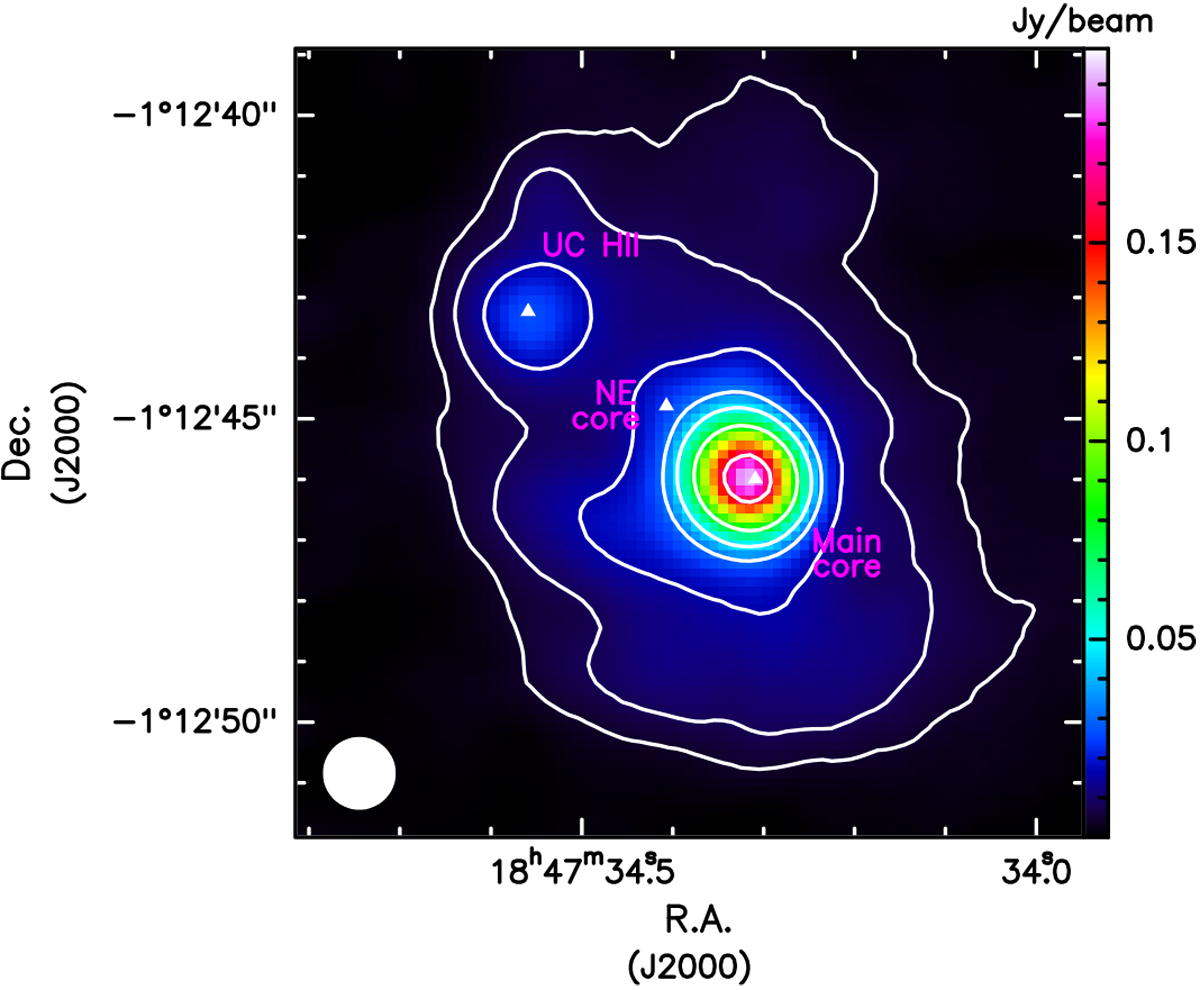
Continuum map of the HMC G31.41+0.31 and the nearby UC HII region. Contour levels are at 5, 10, 20, 40, 60, 100, and 200 times the value of rms = 0.8 mJy beam−1. The three white triangles indicate the coordinates of the Main Core and NE core by Beltrán et al. (2018), and of the UC HII region by Cesaroni et al. (1998). The beam is shown in white in the lower left corner.
Current usage metrics show cumulative count of Article Views (full-text article views including HTML views, PDF and ePub downloads, according to the available data) and Abstracts Views on Vision4Press platform.
Data correspond to usage on the plateform after 2015. The current usage metrics is available 48-96 hours after online publication and is updated daily on week days.
Initial download of the metrics may take a while.