Free Access
Fig. 12
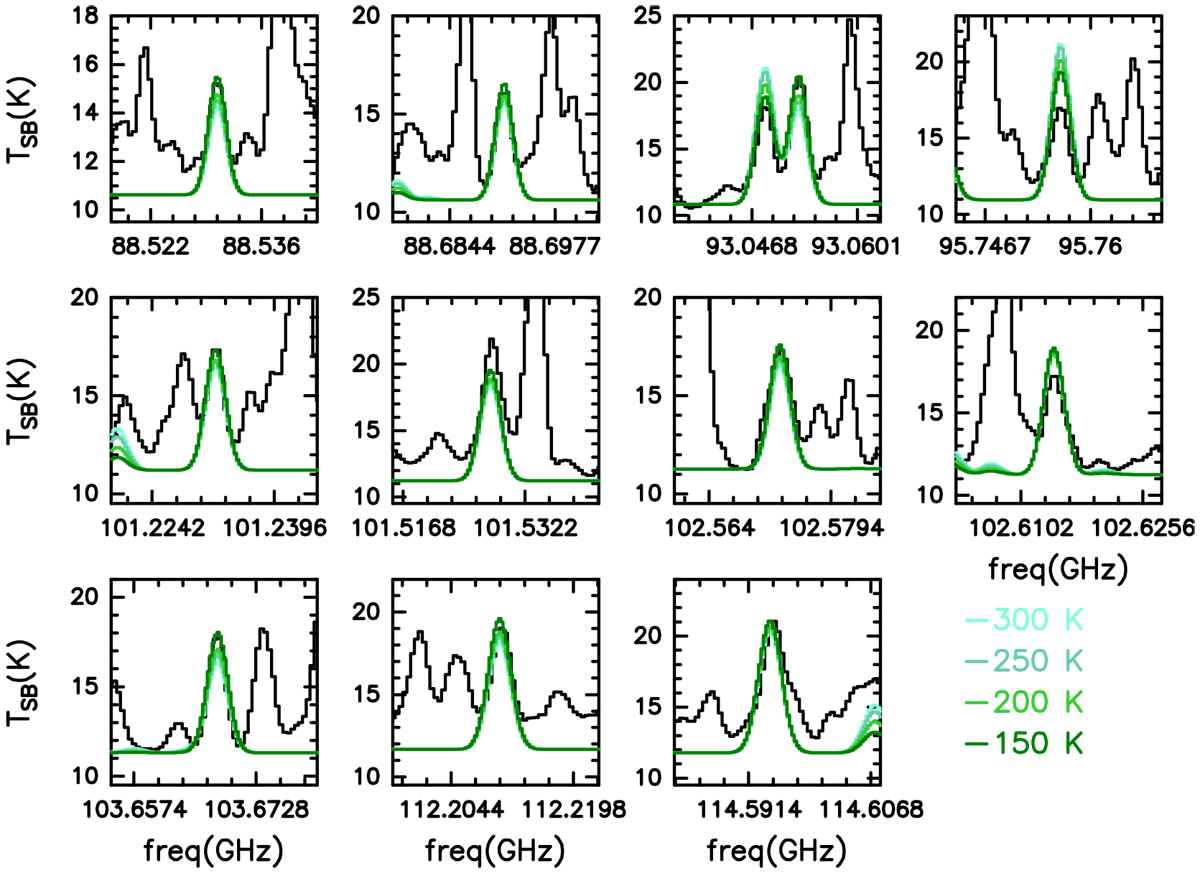
Transitions used to fit glycolaldehyde, with the LTE synthetic spectra simulated assuming different excitation temperatures, and leaving as free parameters only the column density. The values we used are given in Table 7.
Current usage metrics show cumulative count of Article Views (full-text article views including HTML views, PDF and ePub downloads, according to the available data) and Abstracts Views on Vision4Press platform.
Data correspond to usage on the plateform after 2015. The current usage metrics is available 48-96 hours after online publication and is updated daily on week days.
Initial download of the metrics may take a while.