Fig. 7.
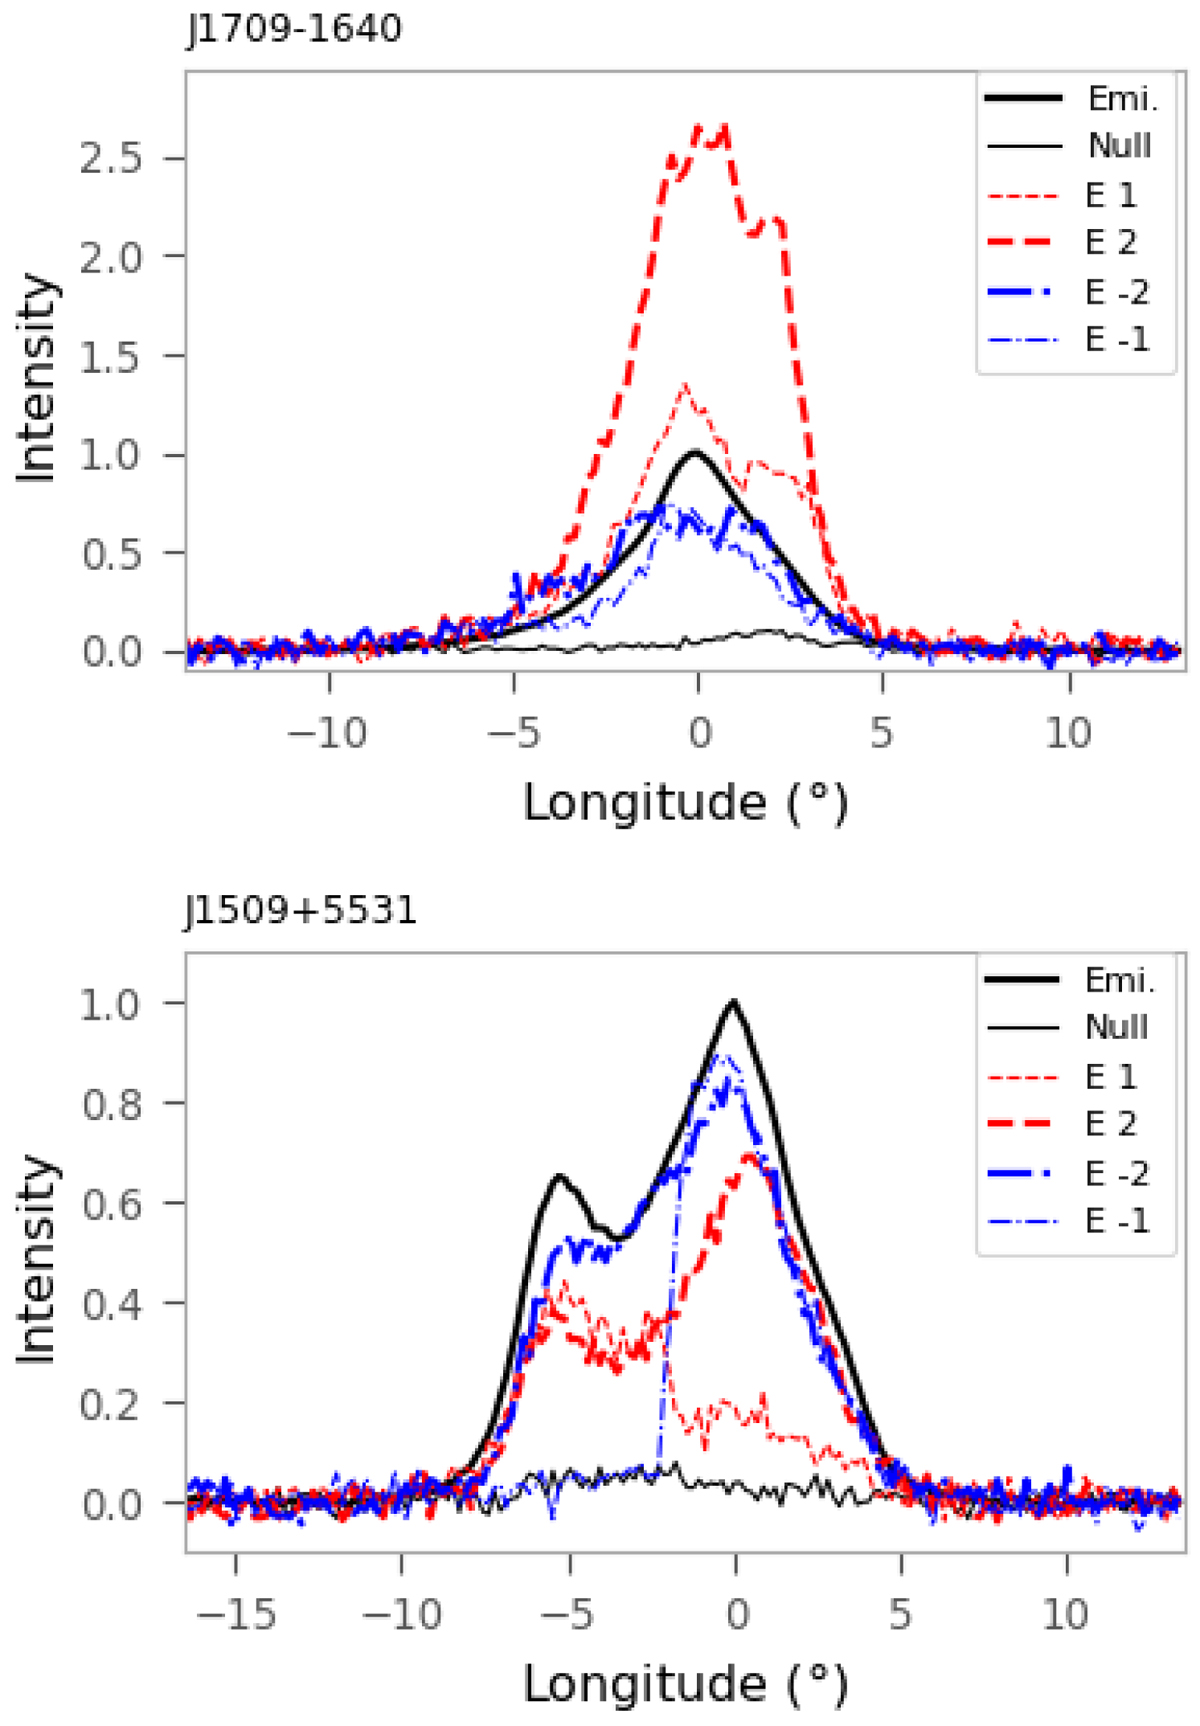
Pulse profiles of PSRs J1709−1640 and J1509+5531 for the emission and nulls are represented by the thick solid and thin solid lines in black. Pulse profiles for the first and second subintegrations of the emission on states, E1 and E2, are represented by dashed lines in red, and those for the last and penultimate subintegrations, E−1 and E−2, are represented by dash-dotted lines in blue.
Current usage metrics show cumulative count of Article Views (full-text article views including HTML views, PDF and ePub downloads, according to the available data) and Abstracts Views on Vision4Press platform.
Data correspond to usage on the plateform after 2015. The current usage metrics is available 48-96 hours after online publication and is updated daily on week days.
Initial download of the metrics may take a while.