Free Access
Fig. 6.
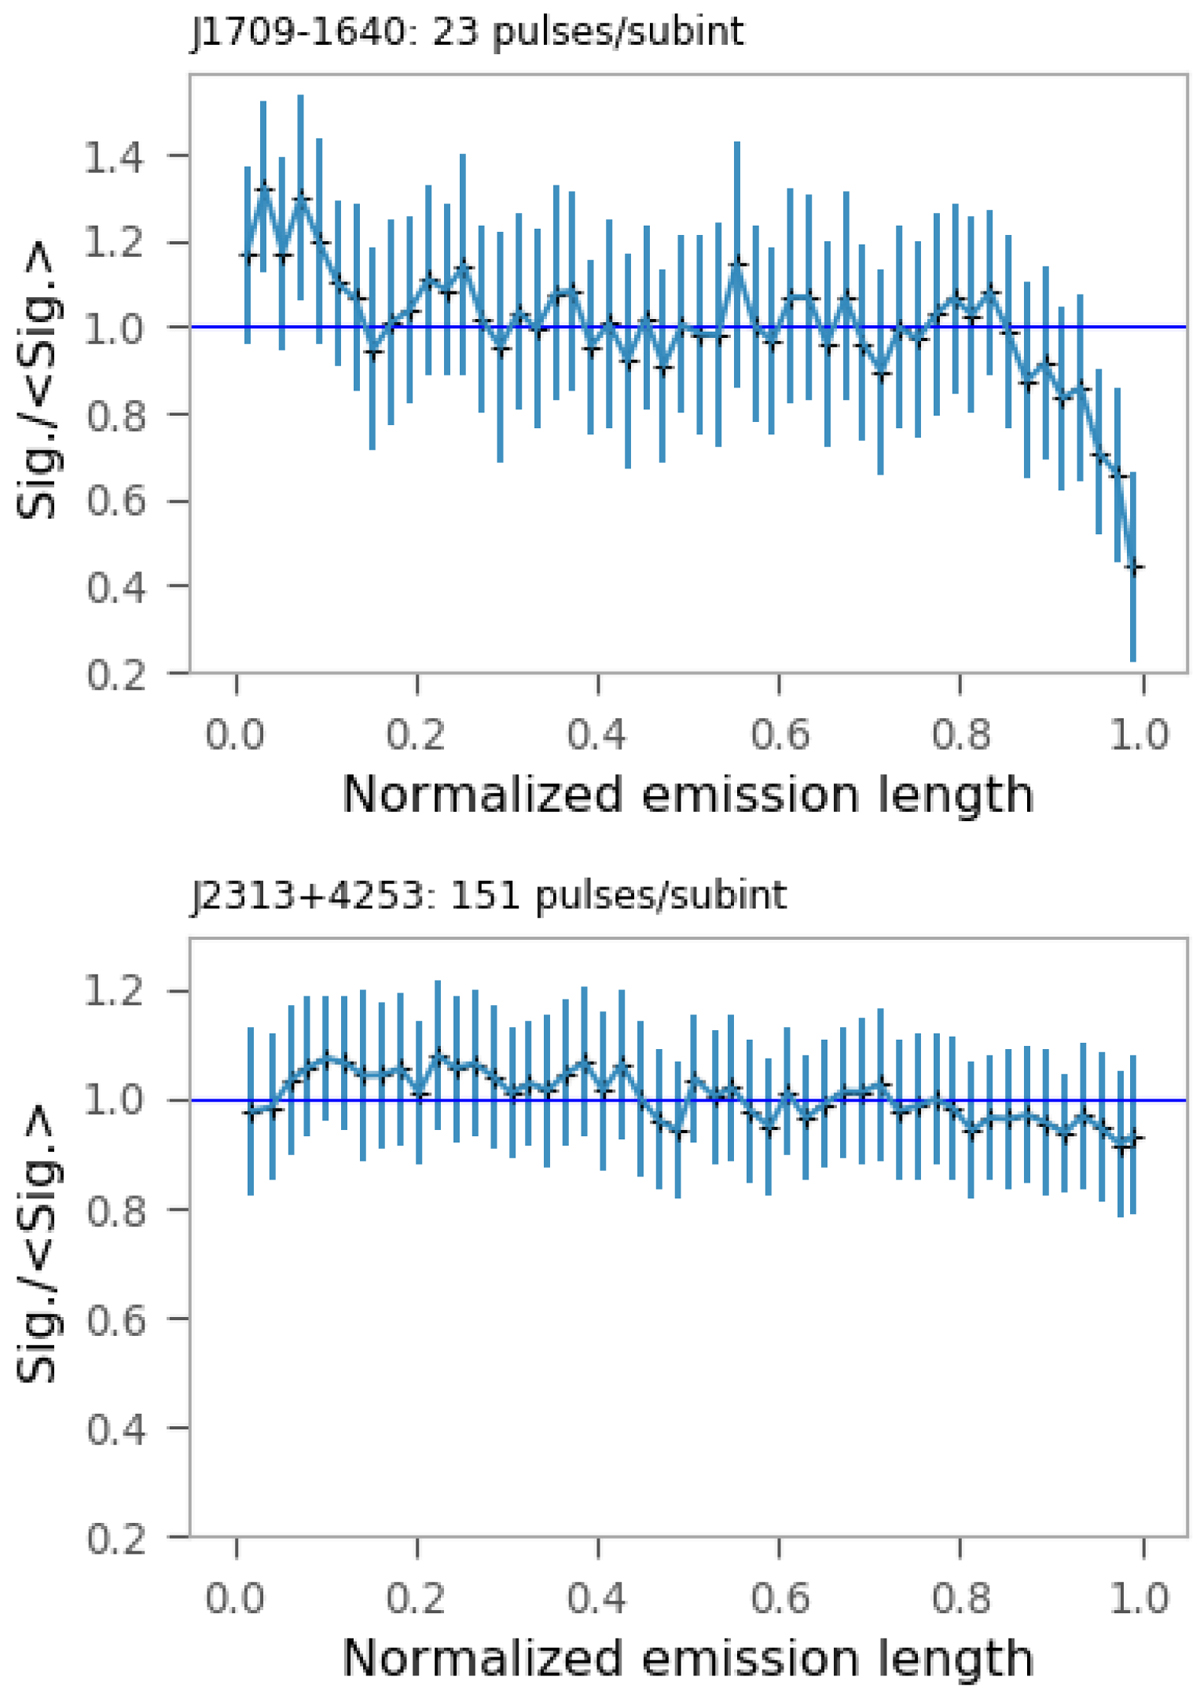
Tendency of pulse intensity variation during the emission states for PSRs J1709−1640 and J2313+4253, normalized by its average intensity and emission length. Black dots with error bars represent the average pulse intensity.
Current usage metrics show cumulative count of Article Views (full-text article views including HTML views, PDF and ePub downloads, according to the available data) and Abstracts Views on Vision4Press platform.
Data correspond to usage on the plateform after 2015. The current usage metrics is available 48-96 hours after online publication and is updated daily on week days.
Initial download of the metrics may take a while.