Fig. B.2.
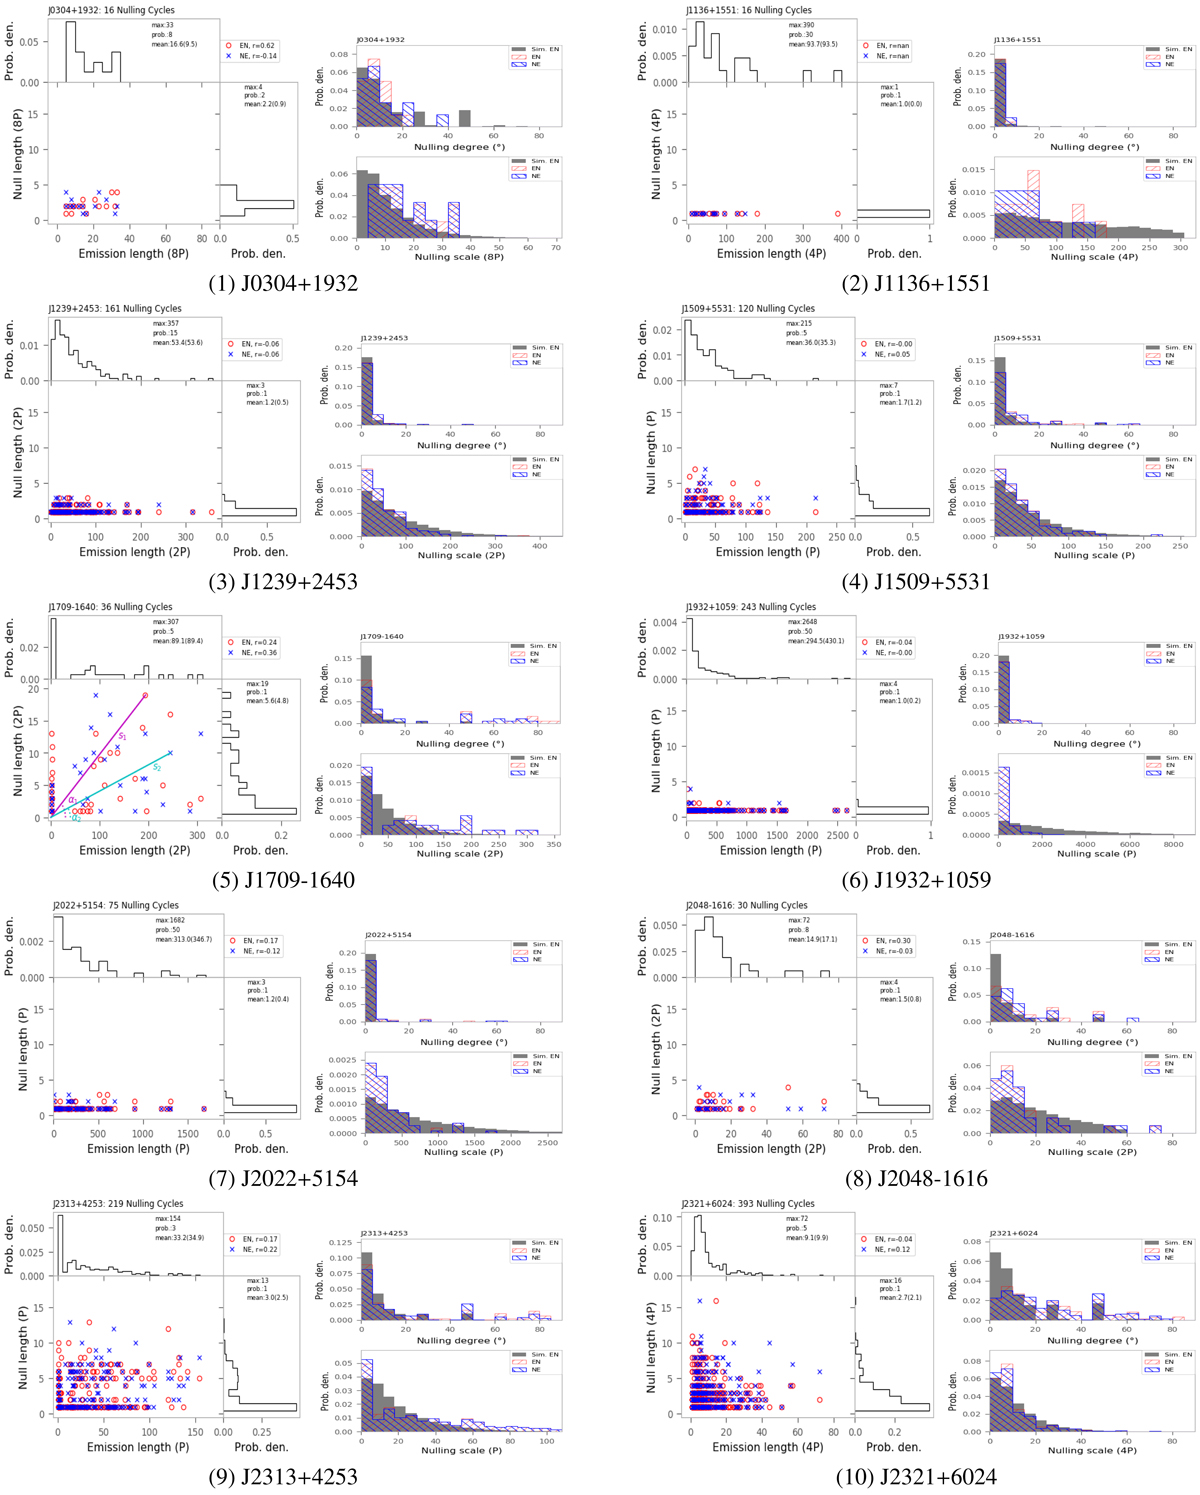
Emission and null lengths and their correlations for ten pulsars. Left panels: distributions of emission and null lengths. Length pairs for the emission and the following null are denoted as EN, and length pairs for the emission and its pre-null are denoted as NE. Correlation coefficients of emission lengths with respect to the null lengths are calculated and indicated in the top right corner for EN and NE. Histograms for the emission and null lengths are drawn in the top and right panels. Right panels: histograms of nulling degrees and scales of emission–null length pairs. The left hatched red step and right hatched blue step represent distributions for the EN and NE length pairs, respectively. The gray bars are for the simulated EN length pairs of randomly distributed emission–null sequence.
Current usage metrics show cumulative count of Article Views (full-text article views including HTML views, PDF and ePub downloads, according to the available data) and Abstracts Views on Vision4Press platform.
Data correspond to usage on the plateform after 2015. The current usage metrics is available 48-96 hours after online publication and is updated daily on week days.
Initial download of the metrics may take a while.