Fig. B.1.
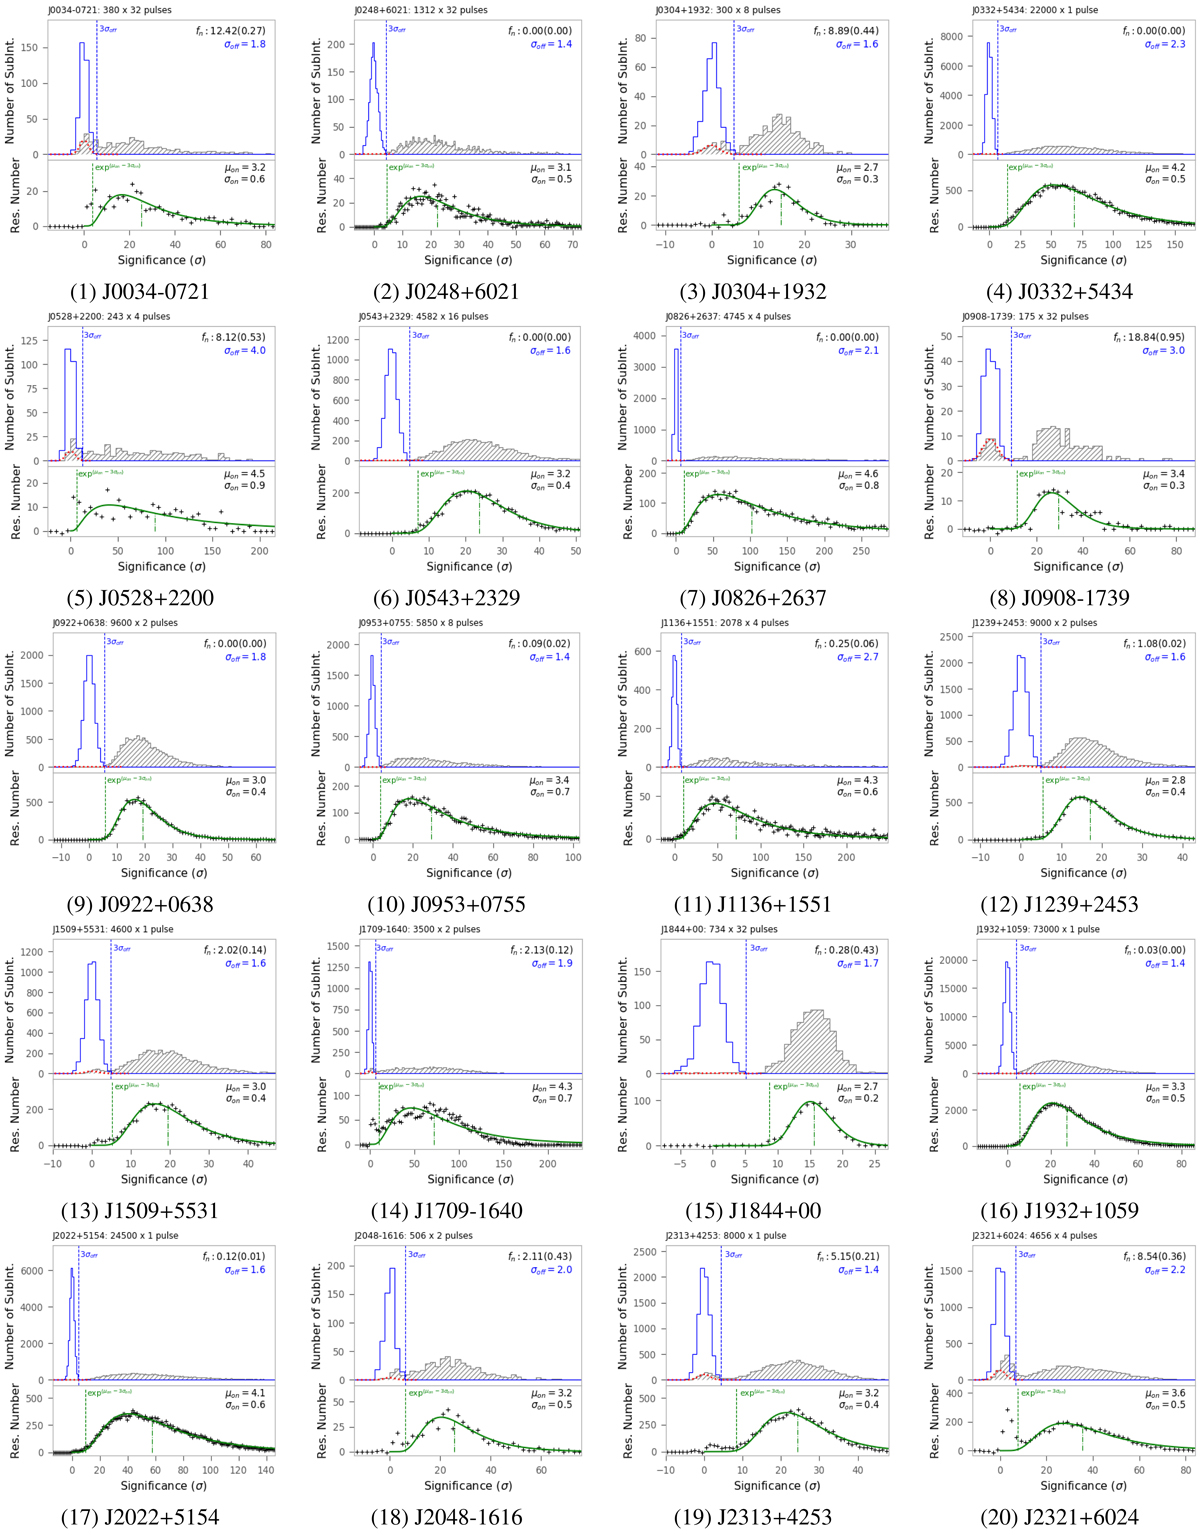
Histograms of the significance of on-pulses and off-pulses for the 20 pulsars. Normal functions with mean zero and standard derivation σoff are employed to model the distribution of off-pulse significance, scaled with fn and represented by a red dotted line. The residual distribution of on-pulse significance is plotted below and modeled by lognormal functions with mean μon and standard derivation σon.
Current usage metrics show cumulative count of Article Views (full-text article views including HTML views, PDF and ePub downloads, according to the available data) and Abstracts Views on Vision4Press platform.
Data correspond to usage on the plateform after 2015. The current usage metrics is available 48-96 hours after online publication and is updated daily on week days.
Initial download of the metrics may take a while.