Fig. 3.
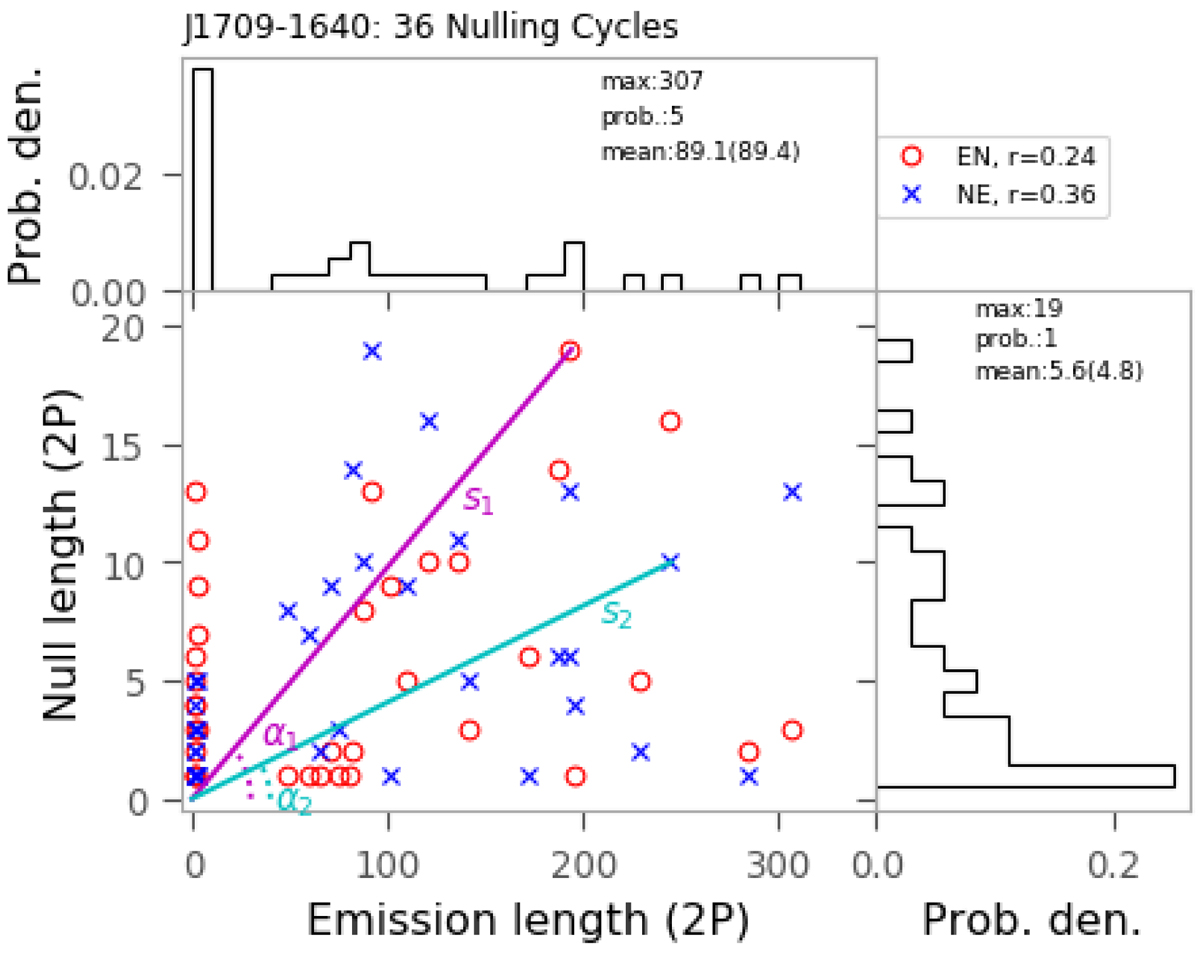
Distributions of emission and null lengths of PSR J1709−1640. Pairs for the emission and the following null are denoted EN and are represented by red “o” symbol, while pairs for the emission and the pre-null are denoted NE and are represented by blue crosses. Nulling degrees, α1 and α2, and nulling scales, s1 and s2, are indicated for EN and NE. The correlation coefficients between emission and null lengths are shown in the top right corner. Histograms for the emission and null lengths are drawn in the top and right panels. Lengths of the longest emission or null state and their most probable and mean values are indicated in each panel.
Current usage metrics show cumulative count of Article Views (full-text article views including HTML views, PDF and ePub downloads, according to the available data) and Abstracts Views on Vision4Press platform.
Data correspond to usage on the plateform after 2015. The current usage metrics is available 48-96 hours after online publication and is updated daily on week days.
Initial download of the metrics may take a while.