Fig. 2.
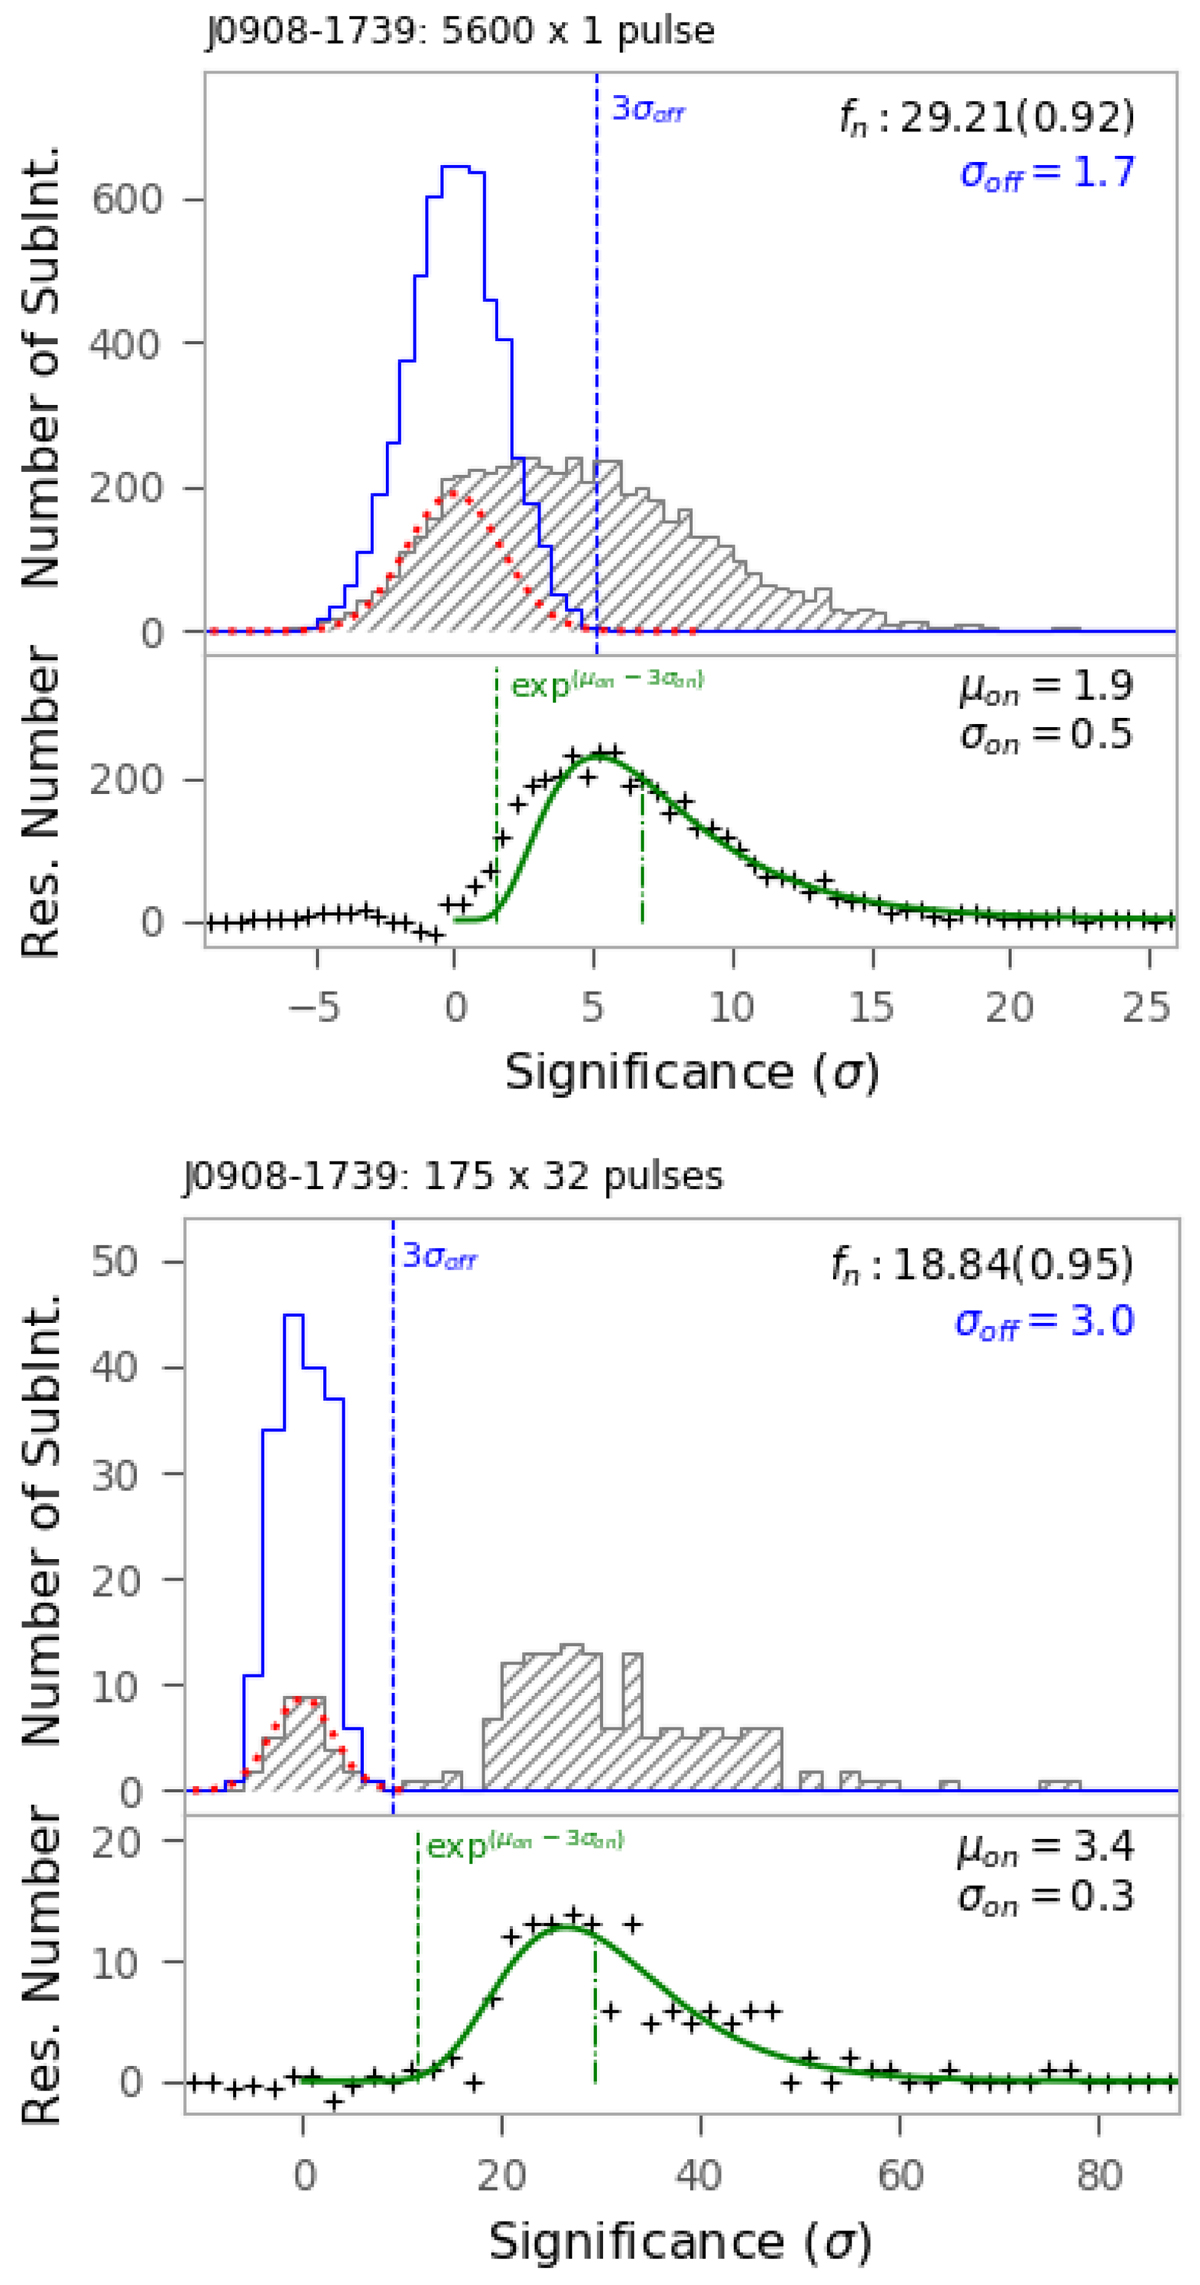
Histograms of the significance of on-pulses (gray hatched step) and off-pulses (blue no hatched step) for PSR J0908−1739 taken on 23 May 2016. The upper plots are for statistics of single pulses, and the lower plots are for subintegrations of every 32 pulses. The distribution of the off-pulse significance can be modeled with a normal function with a mean of zero and a standard deviation of σoff. The normal function is scaled with fn and represented by a red dotted line; it is subtracted from the distribution of on-pulse significance with the residuals indicated by black “plus” symbols in the panel. The residual distribution is modeled by a lognormal function with a mean of μon and a standard deviation of σon. Green solid, dash-dotted, and dashed lines are for the modeled distribution, the mean, and the lower three-sigma limit.
Current usage metrics show cumulative count of Article Views (full-text article views including HTML views, PDF and ePub downloads, according to the available data) and Abstracts Views on Vision4Press platform.
Data correspond to usage on the plateform after 2015. The current usage metrics is available 48-96 hours after online publication and is updated daily on week days.
Initial download of the metrics may take a while.