Fig. 1.
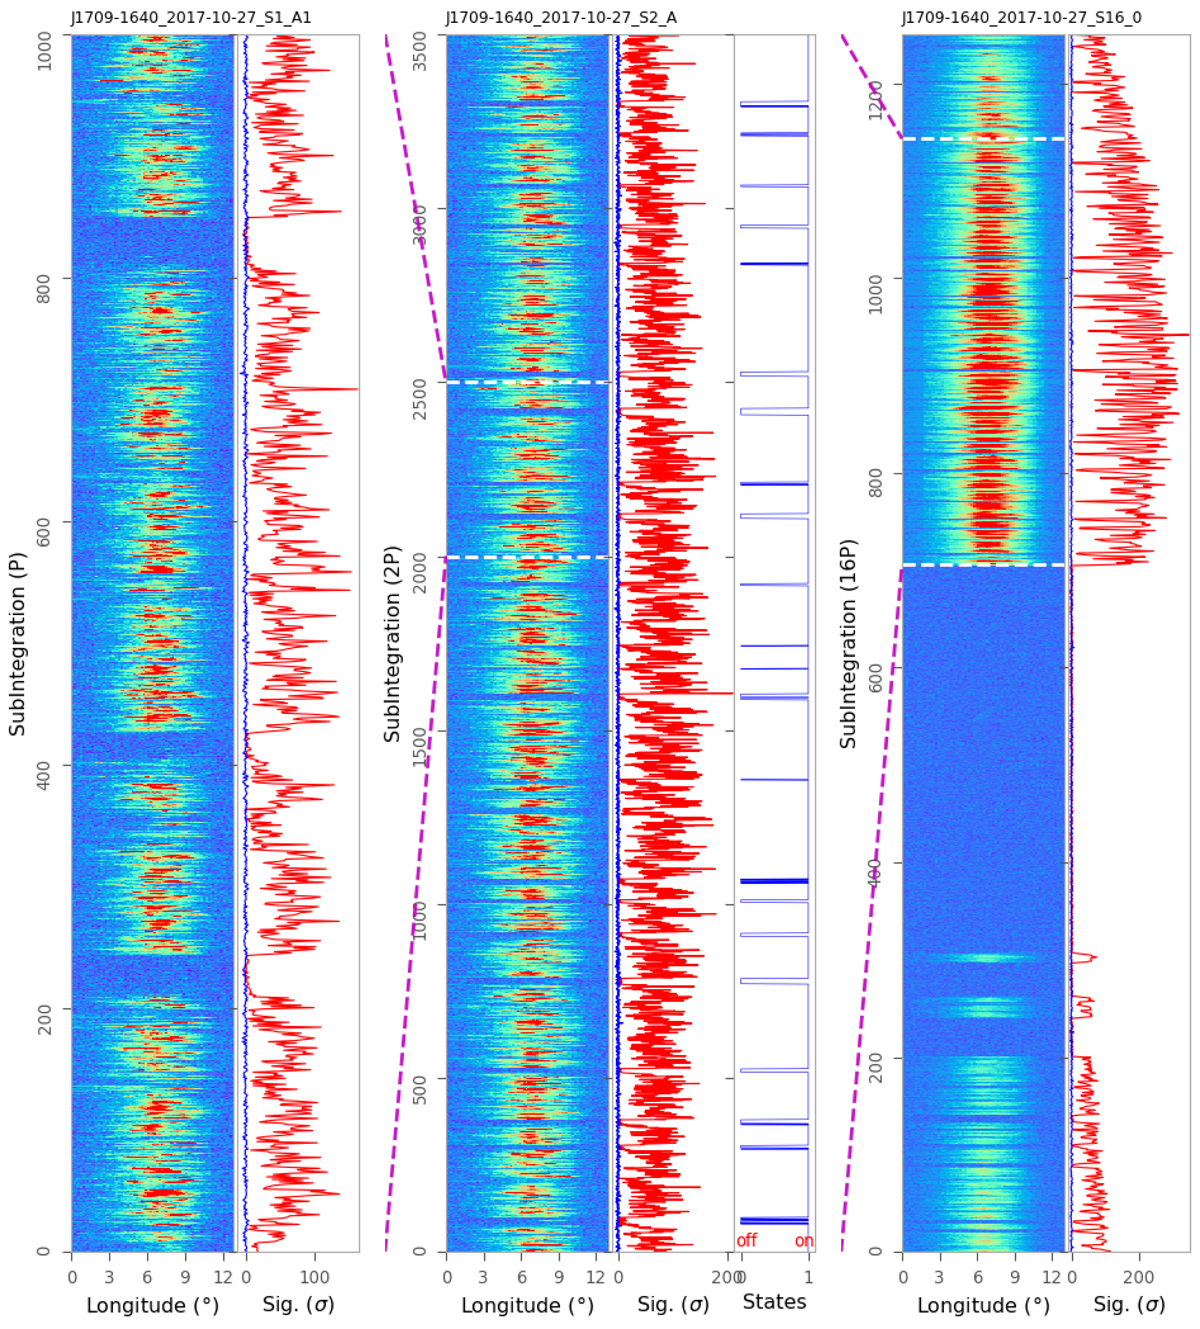
Example of pulse sequence taken on 27 Oct 2017 for PSR J1709−1640. Left plots: part of the observation displayed with single pulses. Left panel: is for intensities of successive pulses. Right panel: is for the significance of on pulse (red) and off pulse (blue) emissions for each pulse. Middle plots: a much longer part of the observation taken for nulling analysis. The subintegrations are formed every two pulses, with its emission (1) or null (0) state indicated. Right plots: entire observation with subintegrations formed every 16 pulses.
Current usage metrics show cumulative count of Article Views (full-text article views including HTML views, PDF and ePub downloads, according to the available data) and Abstracts Views on Vision4Press platform.
Data correspond to usage on the plateform after 2015. The current usage metrics is available 48-96 hours after online publication and is updated daily on week days.
Initial download of the metrics may take a while.