Fig. A.2.
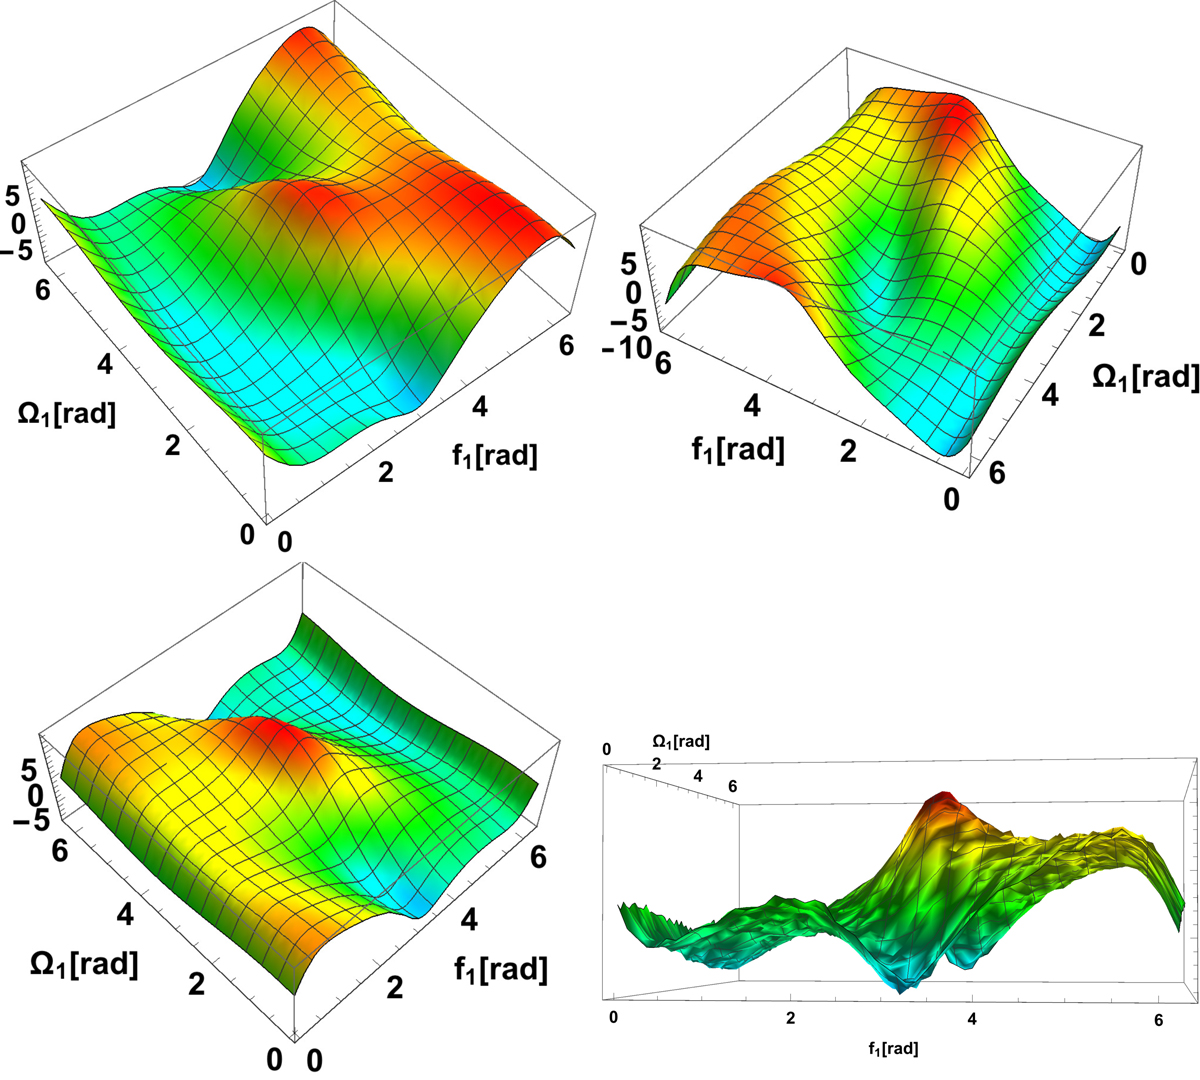
Surface mesh of the values of the first parameter in Eq. (13) over a grid of orbital elements of larger SMBH. The ascending node Ω1 and true anomaly f1 are given in the XY coordinate plane, and values of the calculated parameter are given on the Z-axis. Upper left plot: Case I – parameters are listed in Table A.1a. Upper right plot: Case II – parameters are listed in Table A.1b. Bottom left: Case III – parameters are listed in Table A.1c. Bottom right: Case IV – parameters are listed in Table A.1d.
Current usage metrics show cumulative count of Article Views (full-text article views including HTML views, PDF and ePub downloads, according to the available data) and Abstracts Views on Vision4Press platform.
Data correspond to usage on the plateform after 2015. The current usage metrics is available 48-96 hours after online publication and is updated daily on week days.
Initial download of the metrics may take a while.