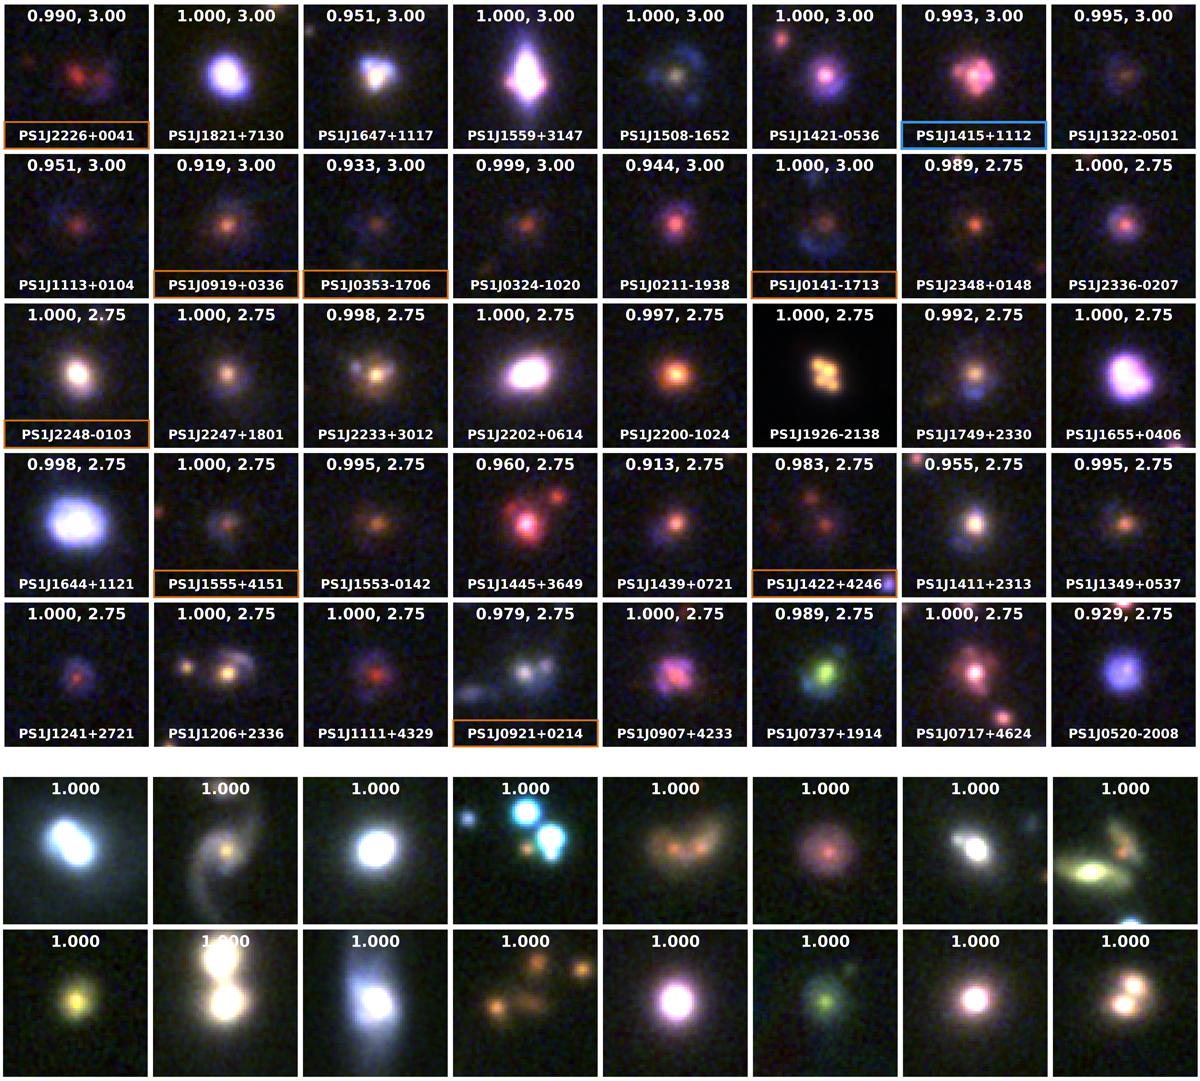
Fig. 9.

Top: Pan-STARRS 3-color gri images of a subset of candidates with grades ≥2 from visual inspection of CNN scores pCNN > 0.9 (the complete figure is available in Appendix A). Numbers displayed on top of each panel are CNN scores (pCNN, left) and average visual grades (right). Candidates with PS1 names marked in orange have been previously published in the literature (see Table 1 and Sect. 6.1) Those marked in blue show unambiguous spectral signatures of high-redshift background sources in our inspection of SDSS BOSS DR16 data. Bottom: examples of random false positives with pCNN = 1. All cutouts are 15″ × 15″.
Current usage metrics show cumulative count of Article Views (full-text article views including HTML views, PDF and ePub downloads, according to the available data) and Abstracts Views on Vision4Press platform.
Data correspond to usage on the plateform after 2015. The current usage metrics is available 48-96 hours after online publication and is updated daily on week days.
Initial download of the metrics may take a while.


