Fig. 2.
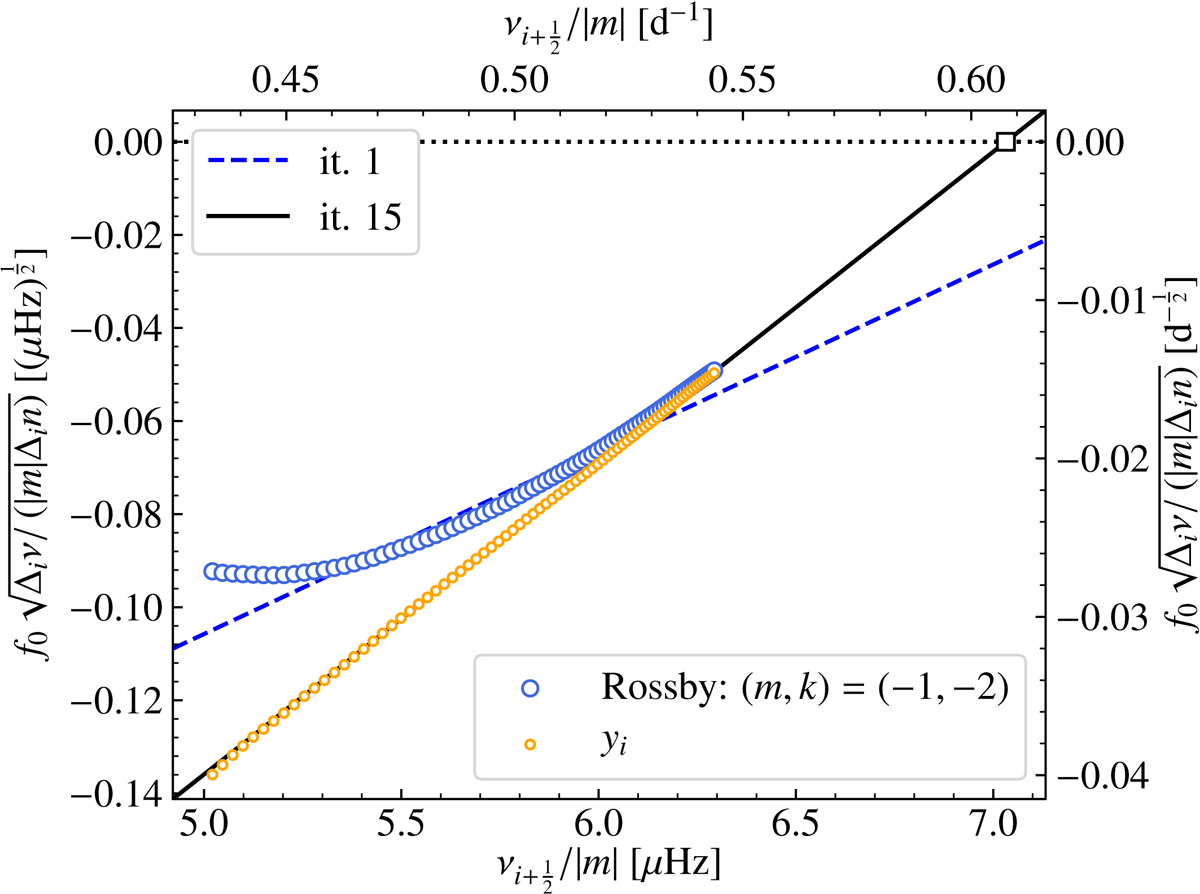
Diagram of ν vs. ![]() based on Rossby modes of Model A with νrot = 7 μHz. Each mode corresponds to an open blue circle, and the dashed and solid lines indicate the fitted lines of the first and fifteenth iteration, respectively. The open square at the abscissa intercept represents the converged value of νrot. Small open orange circles indicate the corrected values
based on Rossby modes of Model A with νrot = 7 μHz. Each mode corresponds to an open blue circle, and the dashed and solid lines indicate the fitted lines of the first and fifteenth iteration, respectively. The open square at the abscissa intercept represents the converged value of νrot. Small open orange circles indicate the corrected values ![]() that are calculated for the converged value of νrot.
that are calculated for the converged value of νrot.
Current usage metrics show cumulative count of Article Views (full-text article views including HTML views, PDF and ePub downloads, according to the available data) and Abstracts Views on Vision4Press platform.
Data correspond to usage on the plateform after 2015. The current usage metrics is available 48-96 hours after online publication and is updated daily on week days.
Initial download of the metrics may take a while.