Free Access
Fig. 9.
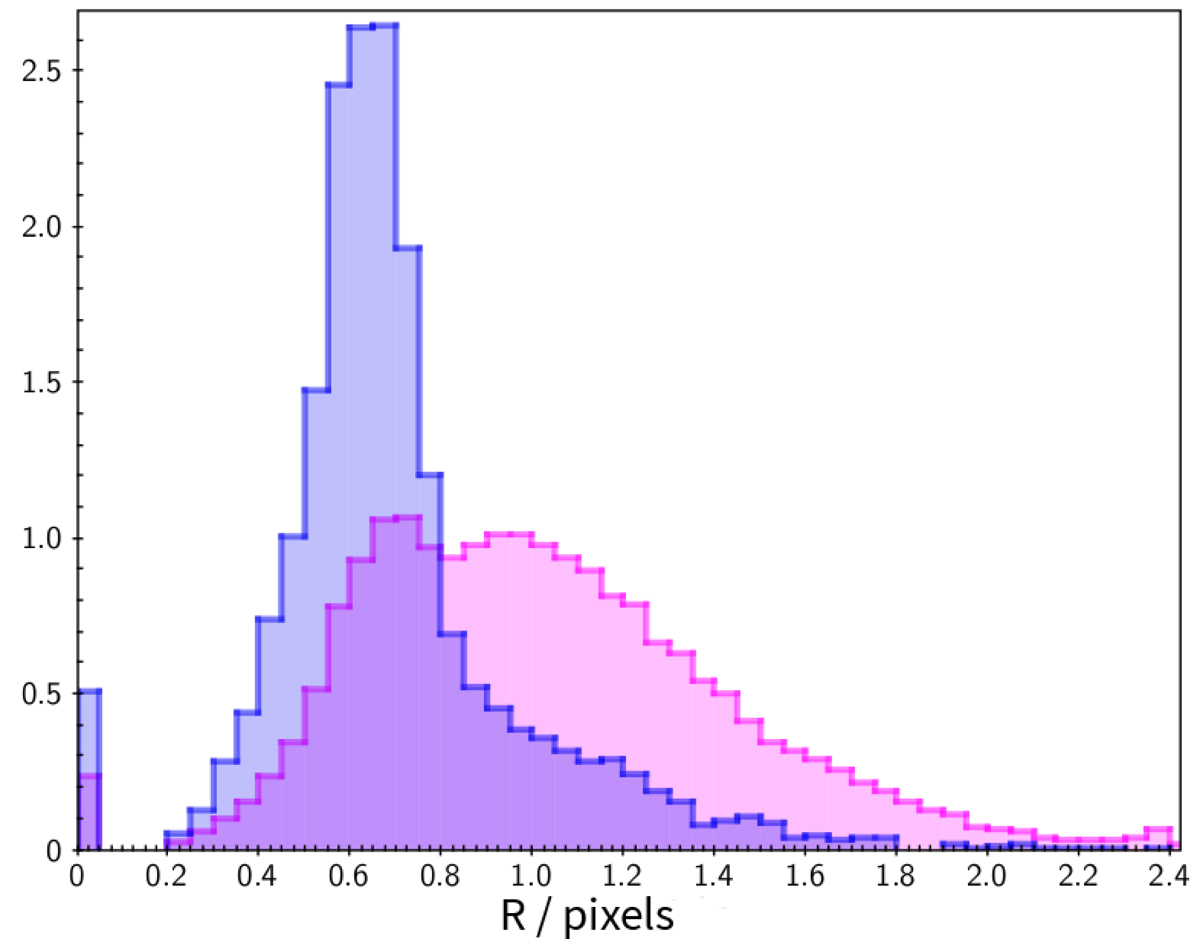
Normalized histograms of the recovered source size R PCCS2 sources are shown in blue and the full catalogue in purple. R has been corrected for the excess resulting from using narrower beams in the likelihood. Beam-sized objects appear in the figure at R ∼ 0. One pixel here corresponds to 1![]() 72.
72.
Current usage metrics show cumulative count of Article Views (full-text article views including HTML views, PDF and ePub downloads, according to the available data) and Abstracts Views on Vision4Press platform.
Data correspond to usage on the plateform after 2015. The current usage metrics is available 48-96 hours after online publication and is updated daily on week days.
Initial download of the metrics may take a while.