Fig. 8.
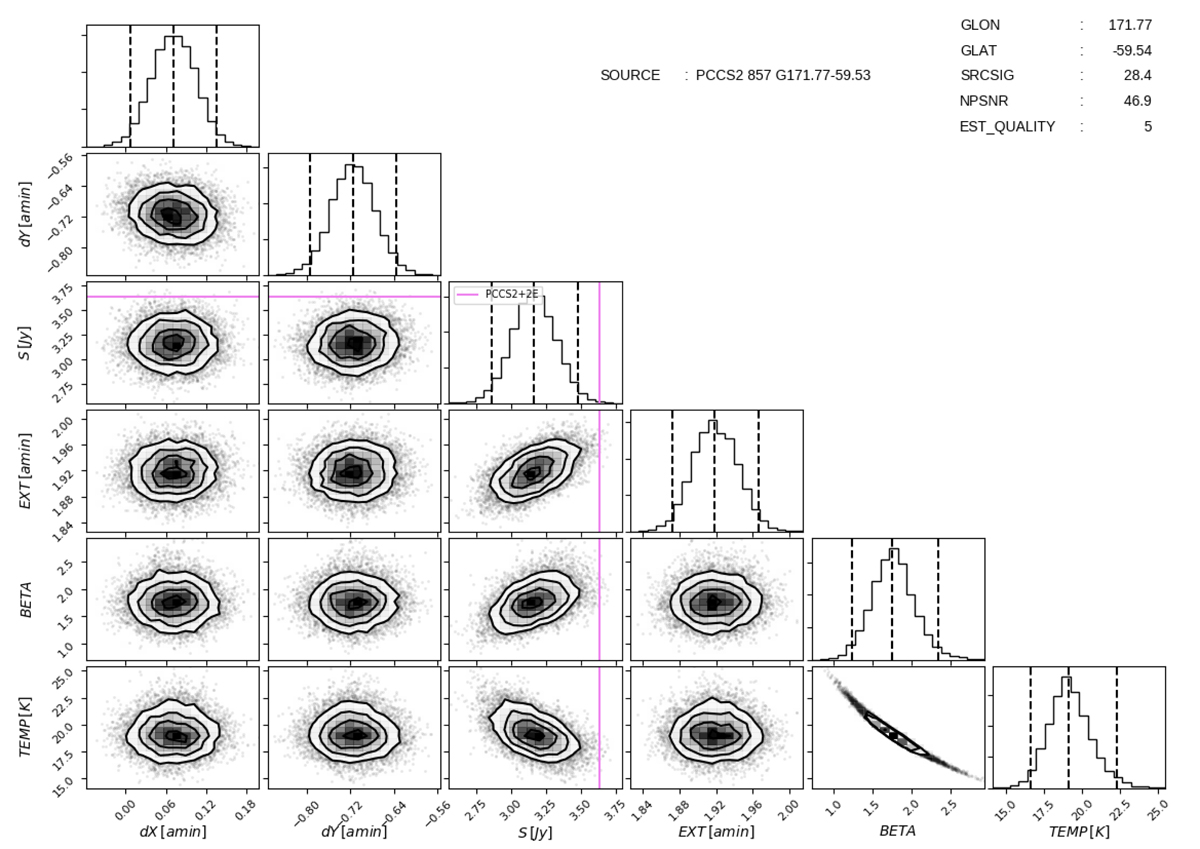
Corner plot (Foreman-Mackey 2016) of parameter posterior distributions for one source (NGC 895). Off-diagonal positions show marginalized bi-dimensional posterior distributions of the parameter samples defining the row and the column. Diagonal positions contain posterior marginalized distributions. The magenta lines mark the PCCS2+2E catalogue flux density in the 857 GHz channel. There is one such plot for each source in BeeP’s catalogue. The source extension (EXT) samples shown have not been corrected for the narrower beams employed in the likelihood. See the Planck Explanatory Supplement for further information (http://www.cosmos.esa.int/web/planck/pla/). This figure is reproduced exactly as it will be delivered to the user from the online archive.
Current usage metrics show cumulative count of Article Views (full-text article views including HTML views, PDF and ePub downloads, according to the available data) and Abstracts Views on Vision4Press platform.
Data correspond to usage on the plateform after 2015. The current usage metrics is available 48-96 hours after online publication and is updated daily on week days.
Initial download of the metrics may take a while.