Fig. 7.
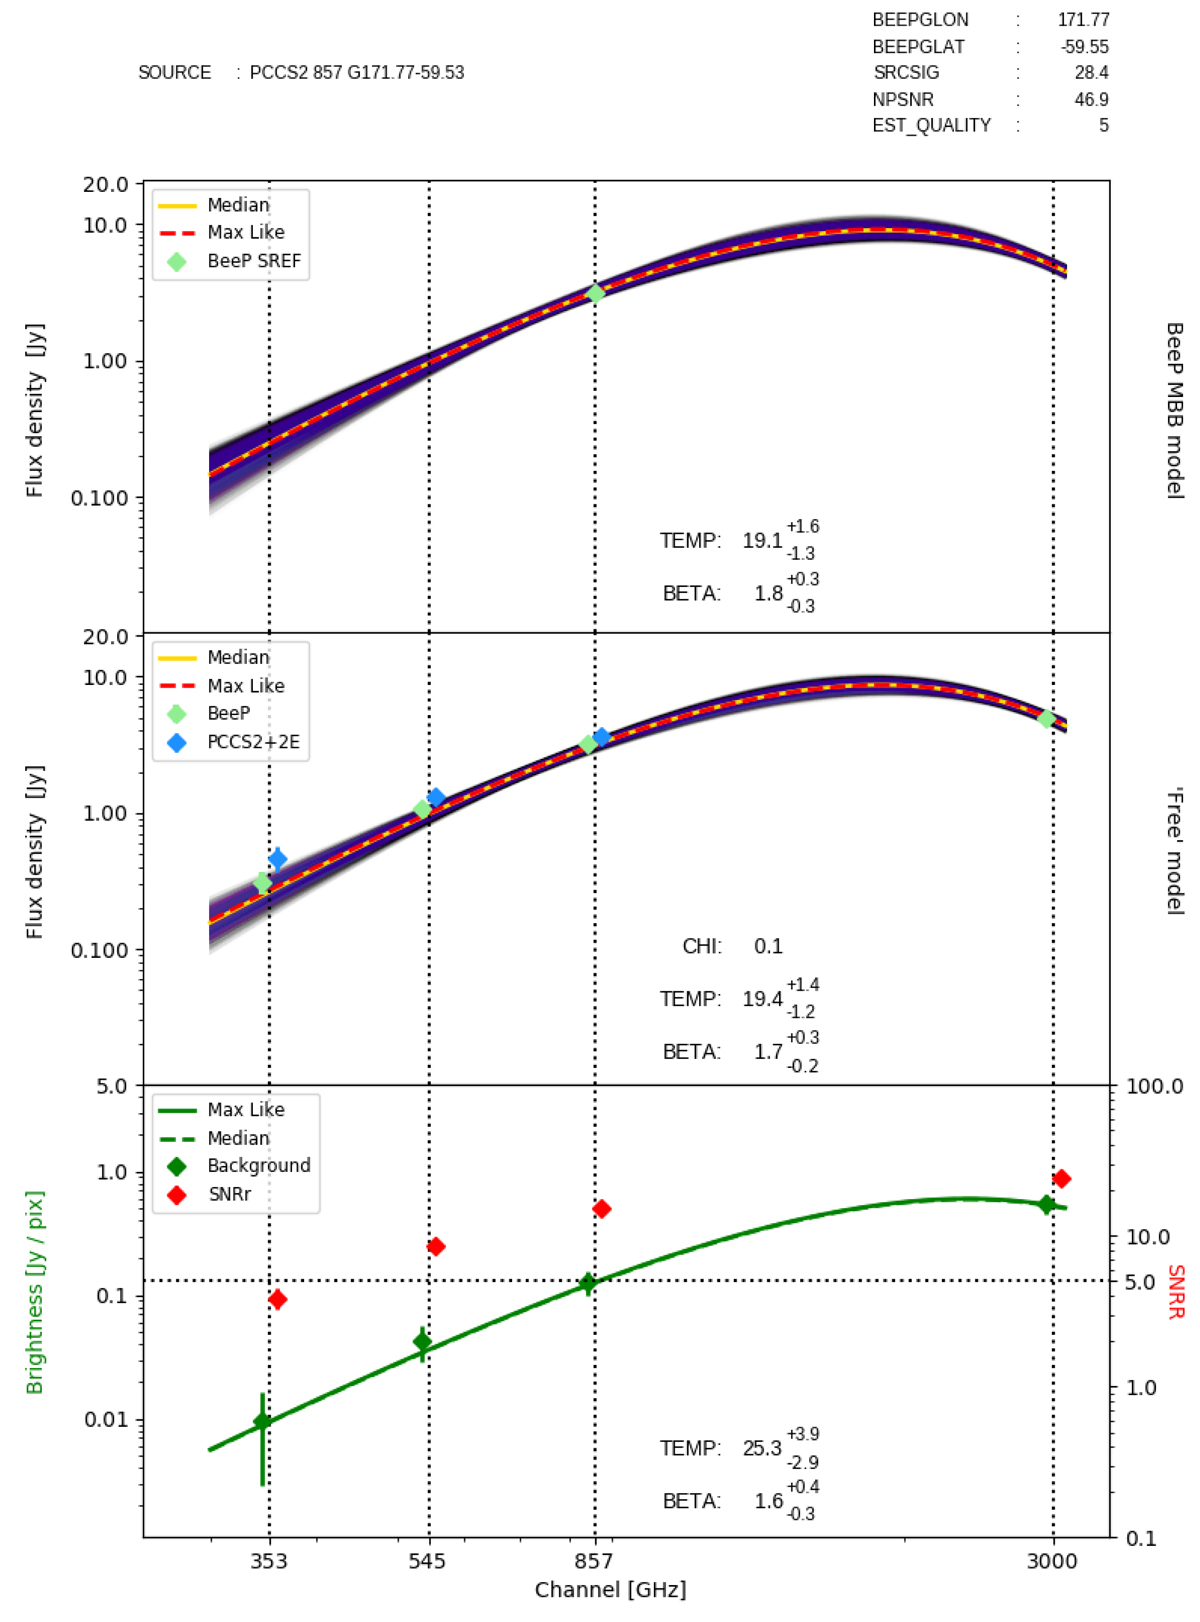
Example of fitting the MBB (upper panel) and Free (middle panel) SED models to the data for one source (NGC 895). The background is given in the bottom panel. The yellow and red dashed curves are the median and maximum-likelihood fits, respectively. The purple and black bands are the ±1 σ and ±2 σ regions, respectively, of the posterior density. Blue diamonds are the PCCS2+2E flux-density estimates (APERFLUX). The green diamonds are: in the upper panel BeeP’s estimate of the flux density at 857 GHz, and in the middle panel BeeP’s Free estimates of the flux density at each frequency. In the lower panel, dark green diamonds are the background brightness estimates at each frequency, and the green curves are the maximum likelihood (dashed) and the median (solid) models. Red diamonds are the average source brightness divided by the background rms brightness in that patch, i.e., raw S/N. The data points are slightly displaced from their nominal frequencies to avoid overlaps. A similar plot is provided in the Planck Legacy Archive for each source in the BeeP catalogue; see the Planck Explanatory Supplement for further information (http://www.cosmos.esa.int/web/planck/pla/). We note that this figure is reproduced exactly as it will be delivered to the user from the online archive. In Appendix D we provide some representative examples of spectra for different kinds of sources, to show some of the results obtained by BeeP.
Current usage metrics show cumulative count of Article Views (full-text article views including HTML views, PDF and ePub downloads, according to the available data) and Abstracts Views on Vision4Press platform.
Data correspond to usage on the plateform after 2015. The current usage metrics is available 48-96 hours after online publication and is updated daily on week days.
Initial download of the metrics may take a while.