Fig. 6.
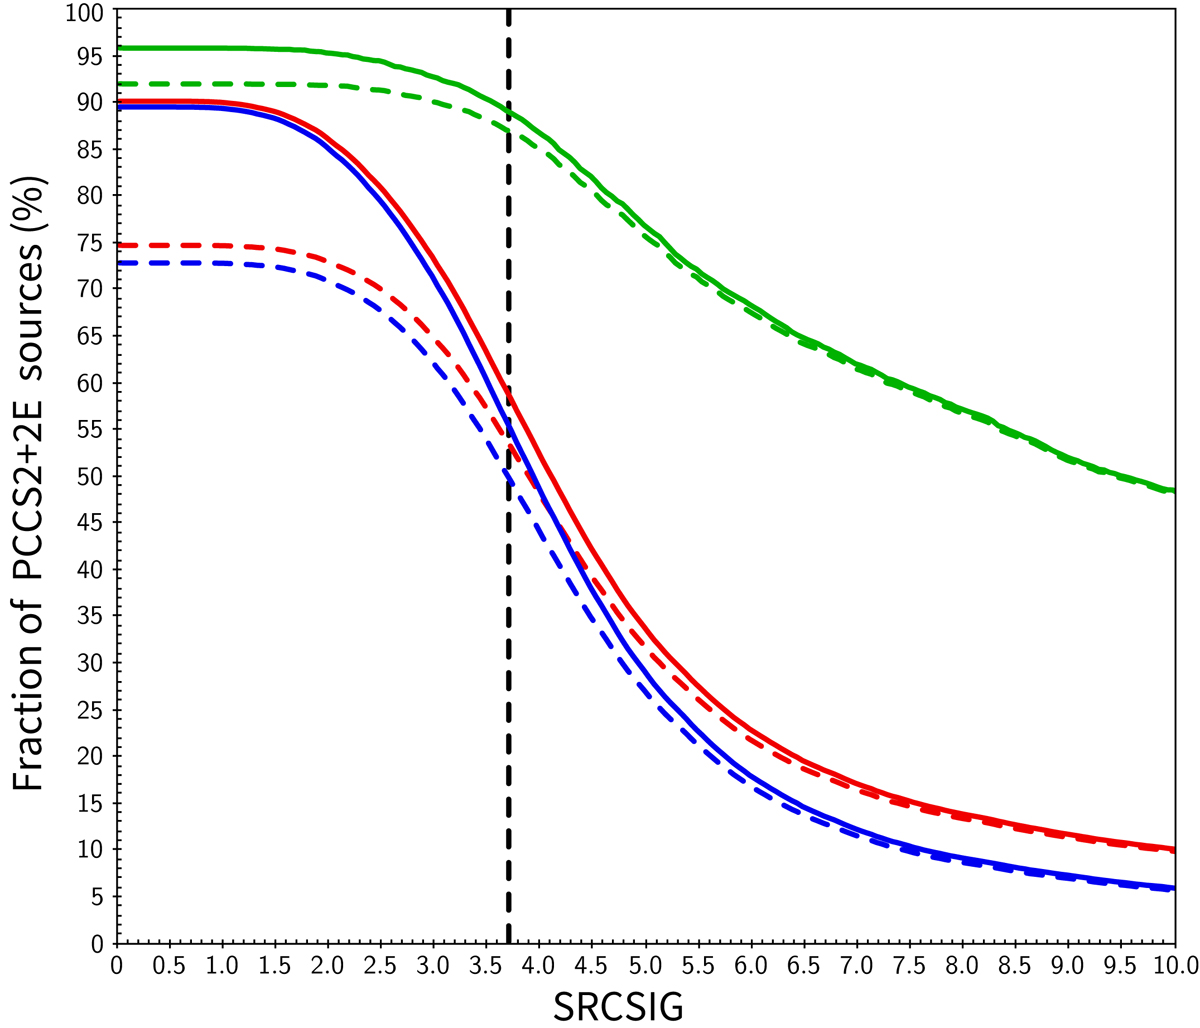
Fraction of PCCS2+2E sources with NPSNR > 5 and above a given SRCSIG threshold. Green curves show PCCS2 sources, blue curves show PCCS2E sources, and red curves show the full PCCS2+2E. Dashed lines are the result of imposing MAXFOUND = 1. The dashed black vertical line (SRCSIG = 3.7) is the reliability criterion threshold that we have selected for the BeeP/base catalogue.
Current usage metrics show cumulative count of Article Views (full-text article views including HTML views, PDF and ePub downloads, according to the available data) and Abstracts Views on Vision4Press platform.
Data correspond to usage on the plateform after 2015. The current usage metrics is available 48-96 hours after online publication and is updated daily on week days.
Initial download of the metrics may take a while.