Fig. D.7.
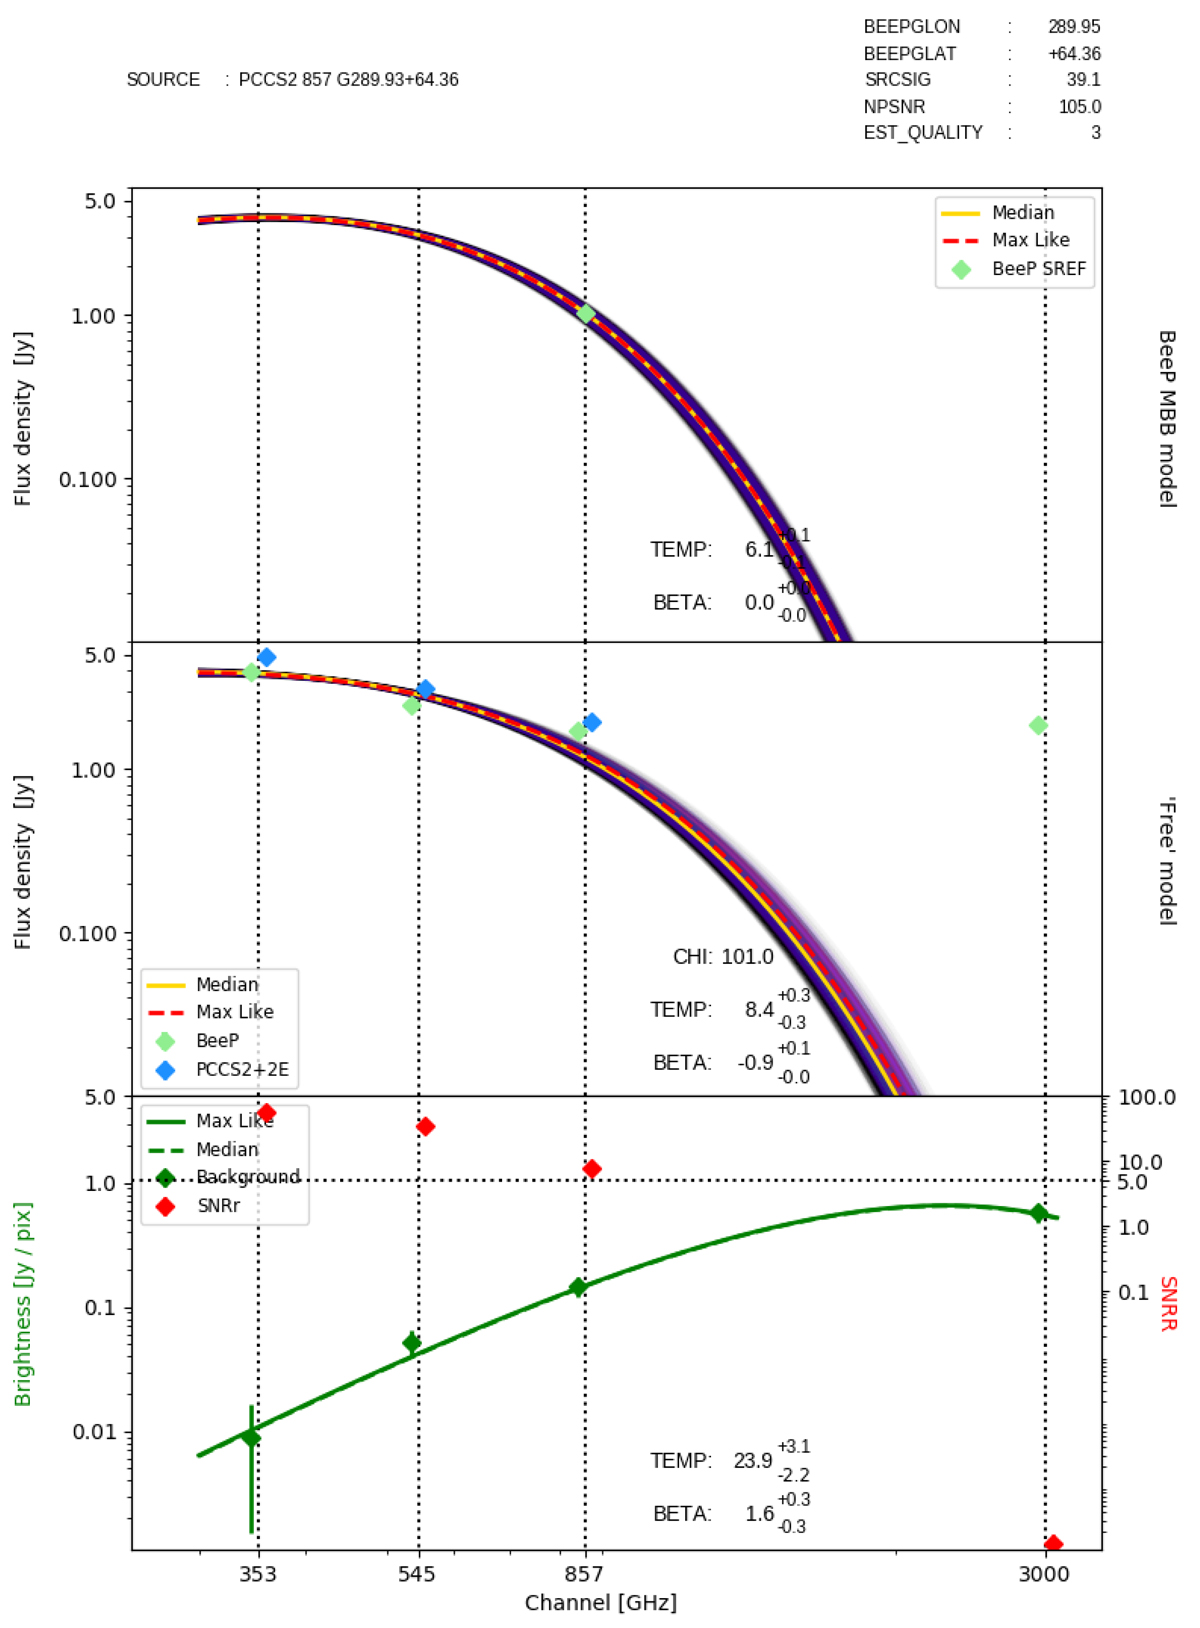
Results of BeeP analysis for 3C 273. See the caption of Fig. 7 for a full description. As in the previous figure, this is a non-thermal source, and BeeP also obtains very poor results (though not as extreme as in the previous case). The flux density of the source in the IRIS map is highly anomalous, but also has very low S/N ratio with respect to the well-determined background.
Current usage metrics show cumulative count of Article Views (full-text article views including HTML views, PDF and ePub downloads, according to the available data) and Abstracts Views on Vision4Press platform.
Data correspond to usage on the plateform after 2015. The current usage metrics is available 48-96 hours after online publication and is updated daily on week days.
Initial download of the metrics may take a while.