Fig. D.2.
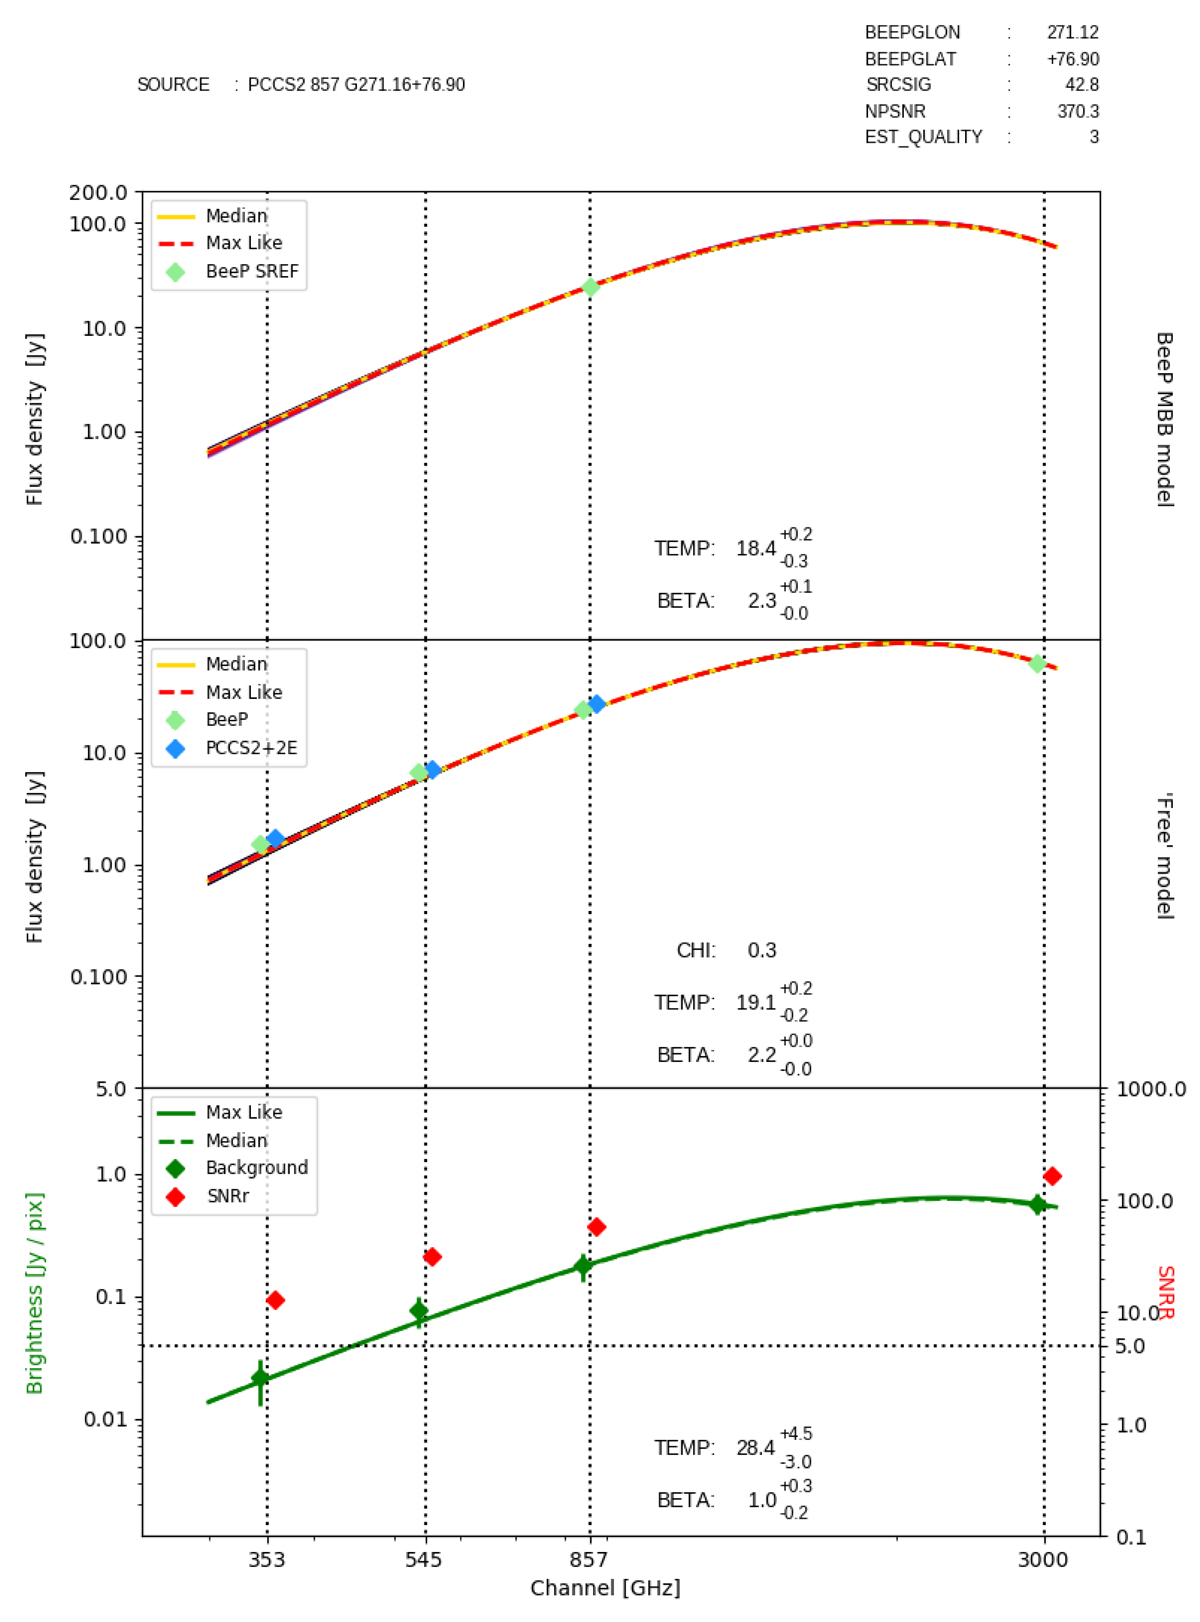
Results of BeeP analysis for M 100. See the caption of Fig. 7 for a full explanation. This case is interesting because BeeP has reduced EST_QUALITY due to the extremely low uncertainties in both temperature and spectral index (Sect. 5.2), in spite of the fact that the SEDs fit the data very well. However the χ2 value of the Free-model fit (middle panel) is not far from the expected unity-per-degree of freedom level, and so this is one of those exceptional cases where the very low uncertainties reflect a very good fit, rather than the fact that the sampler has not been able to explore the parameter space.
Current usage metrics show cumulative count of Article Views (full-text article views including HTML views, PDF and ePub downloads, according to the available data) and Abstracts Views on Vision4Press platform.
Data correspond to usage on the plateform after 2015. The current usage metrics is available 48-96 hours after online publication and is updated daily on week days.
Initial download of the metrics may take a while.