Fig. B.9.
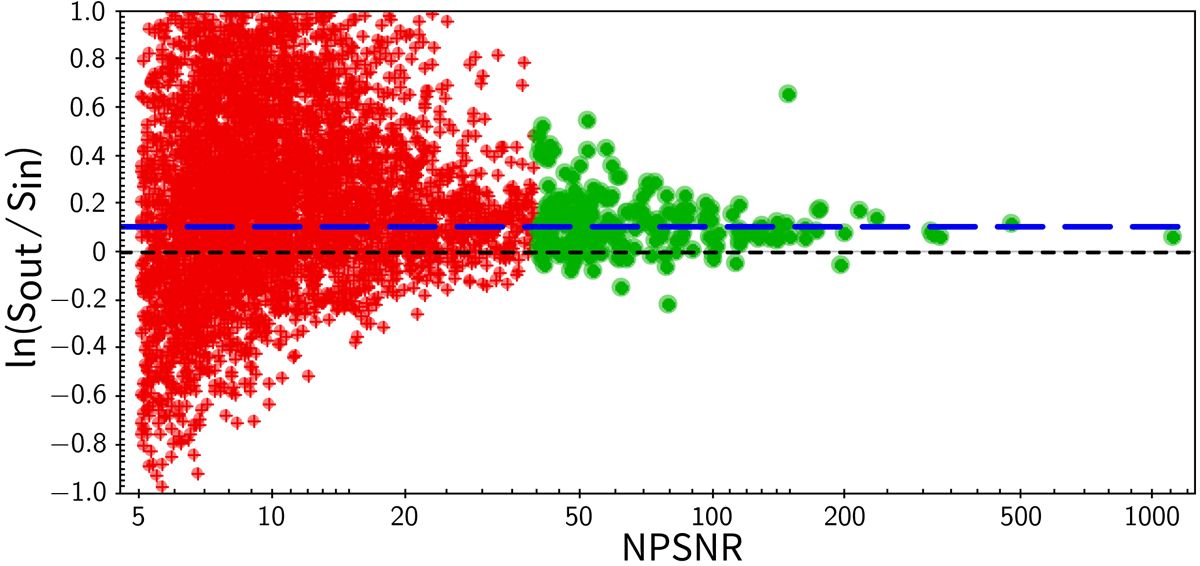
Comparison of FFP8’s full catalogue of bright source flux densities with BeeP’s SREF. Shown in red are the source flux estimates with NPSNR< 40 and in green those with NPSNR> 40. The horizontal long-dashed blue line is the ln(Sout/Sin) median (0.104) of the green subset. The strong outlier is the result of a mock source blended with a real one.
Current usage metrics show cumulative count of Article Views (full-text article views including HTML views, PDF and ePub downloads, according to the available data) and Abstracts Views on Vision4Press platform.
Data correspond to usage on the plateform after 2015. The current usage metrics is available 48-96 hours after online publication and is updated daily on week days.
Initial download of the metrics may take a while.