Fig. B.8.
Small field (![]() ) centred at
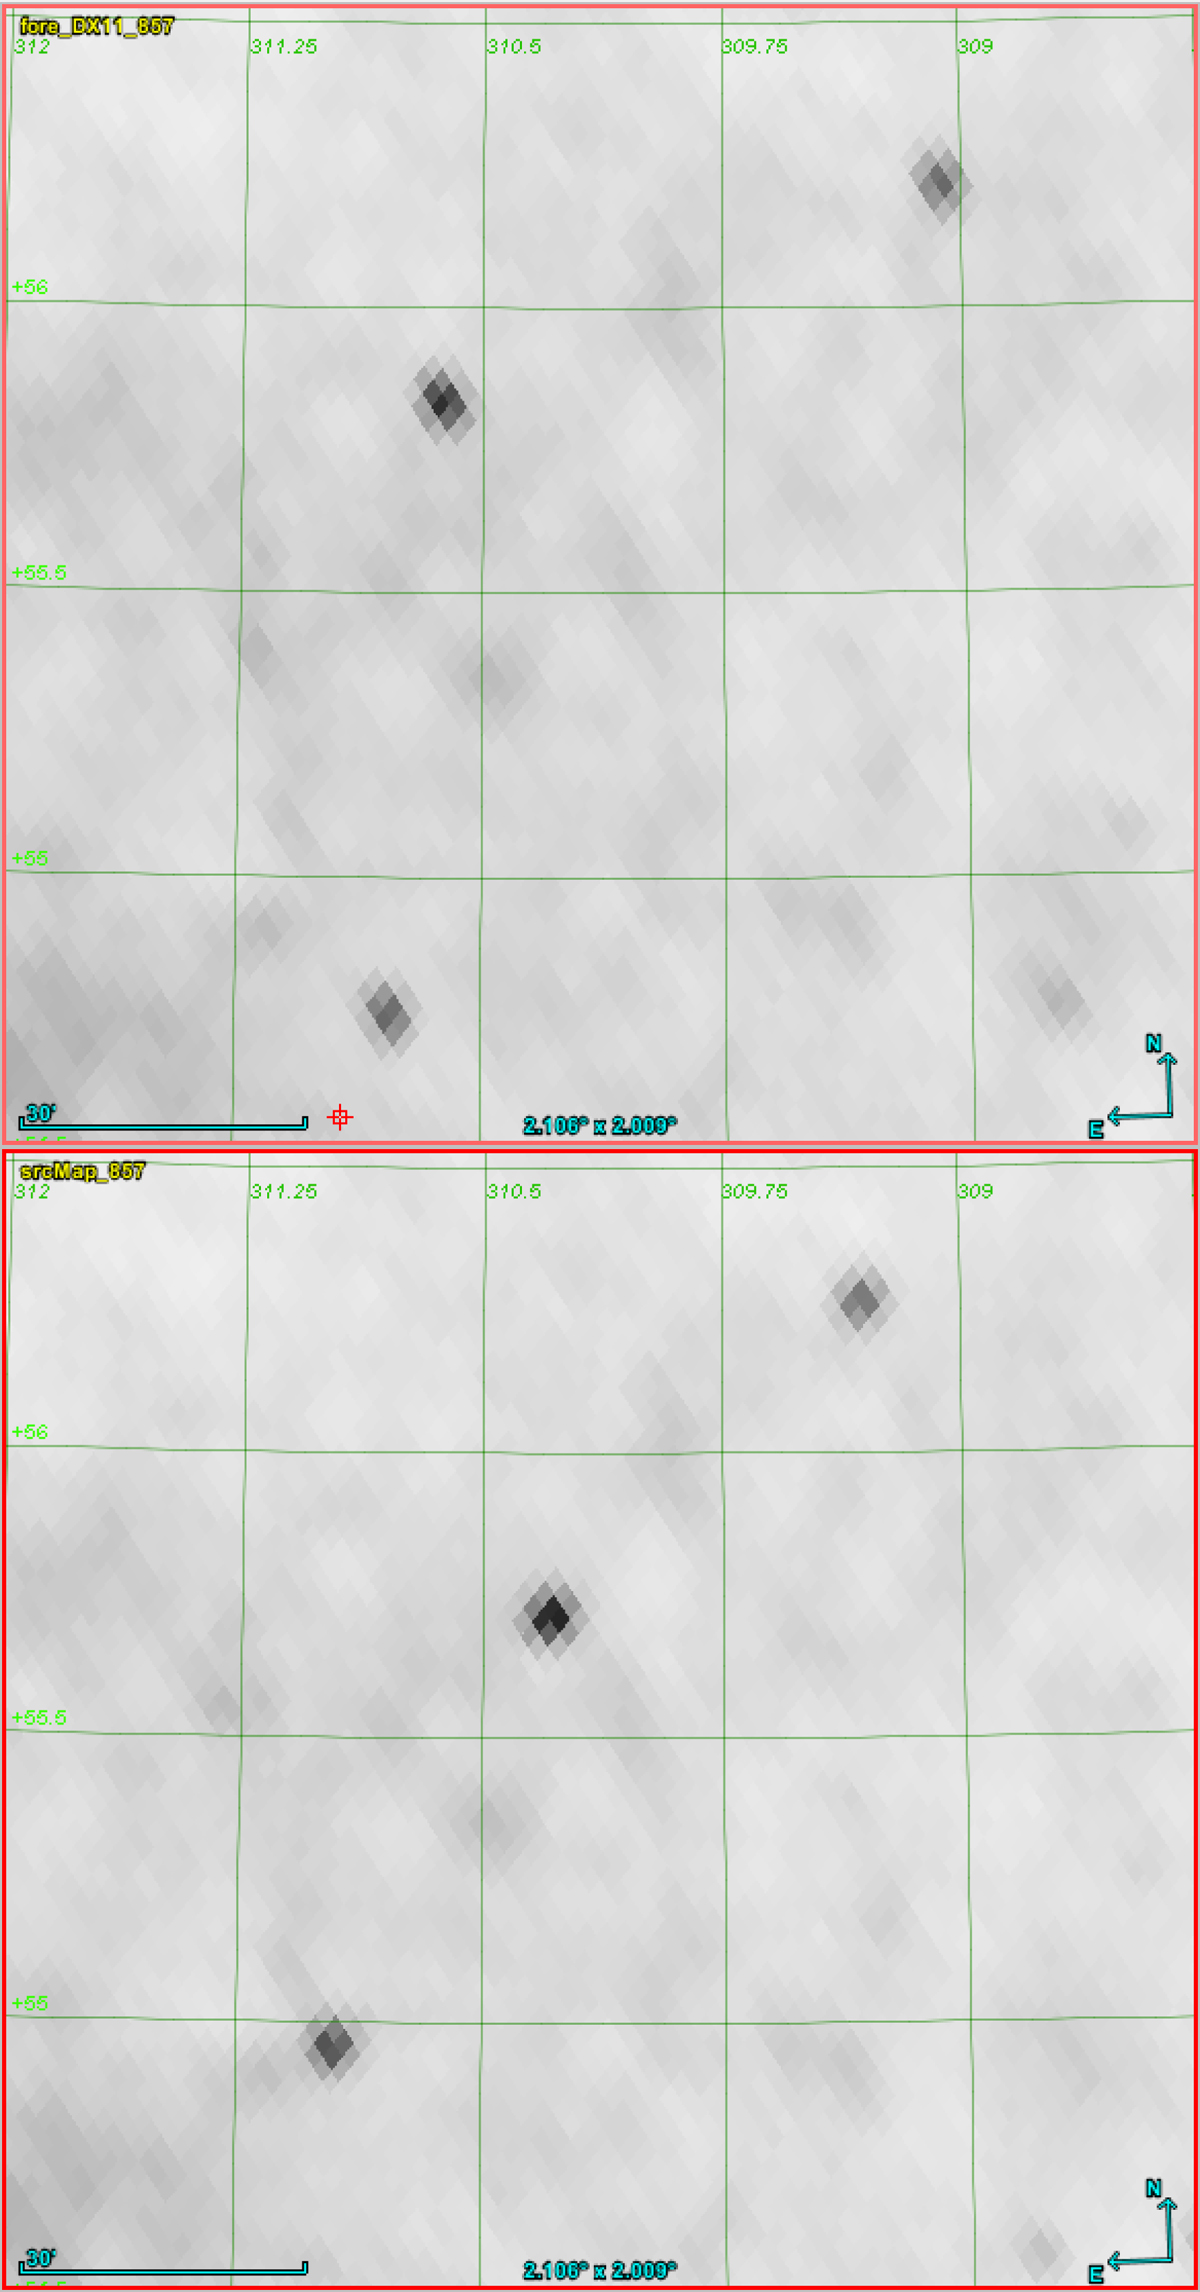
) centred at ![]() . Upper panel: Planck’s 857 GHz map and lower: BeeP injection simulation where mock sources were added to the same Planck map around the neighbourhood of real sources that were masked and inpainted. The simulated sources were rendered using the average effective Gaussian 857 GHz Planck beam. The brightness scale is the same on both plots. One can see in the lower panel that the injection simulations fail to capture the ellipticity of compact objects in the Planck 857 GHz map (upper panel).
. Upper panel: Planck’s 857 GHz map and lower: BeeP injection simulation where mock sources were added to the same Planck map around the neighbourhood of real sources that were masked and inpainted. The simulated sources were rendered using the average effective Gaussian 857 GHz Planck beam. The brightness scale is the same on both plots. One can see in the lower panel that the injection simulations fail to capture the ellipticity of compact objects in the Planck 857 GHz map (upper panel).
Current usage metrics show cumulative count of Article Views (full-text article views including HTML views, PDF and ePub downloads, according to the available data) and Abstracts Views on Vision4Press platform.
Data correspond to usage on the plateform after 2015. The current usage metrics is available 48-96 hours after online publication and is updated daily on week days.
Initial download of the metrics may take a while.