Fig. B.7.
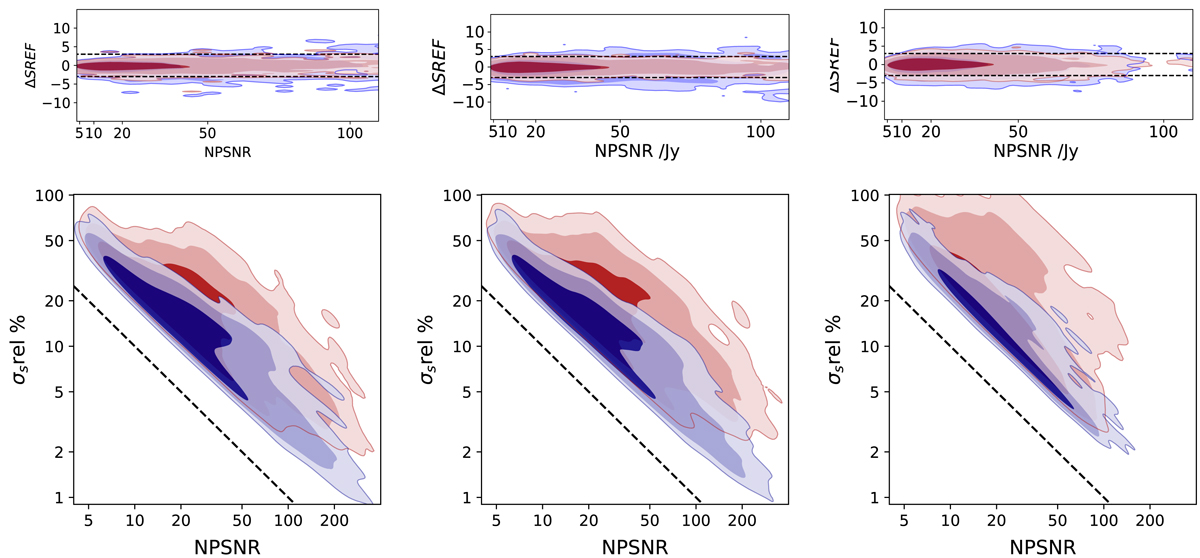
Comparison of injected and recovered flux densities. Upper row: distribution of the normalized difference (Eq. (B.1), blue contours, [68, 95, 99]%) versus NPSNR for three different data sets (from left to right): PCCS2 “same location”; PCCS2 “neighbourhood”; and PCCS2E ∧ |b| > 10° “neighbourhood”. The red contours show the same as the blue ones, but this time for corrected values (Eq. (B.5)). The horizontal dashed lines are ±3 σ. Lower row: identical flux-density relative error (ΔSREF/SREF) distribution contours. The black dashed lines here are NPSNR−1, the lower limit of the flux-density relative error, which is only achievable if the only unknown parameter in the model is the flux density.
Current usage metrics show cumulative count of Article Views (full-text article views including HTML views, PDF and ePub downloads, according to the available data) and Abstracts Views on Vision4Press platform.
Data correspond to usage on the plateform after 2015. The current usage metrics is available 48-96 hours after online publication and is updated daily on week days.
Initial download of the metrics may take a while.