Fig. B.6.
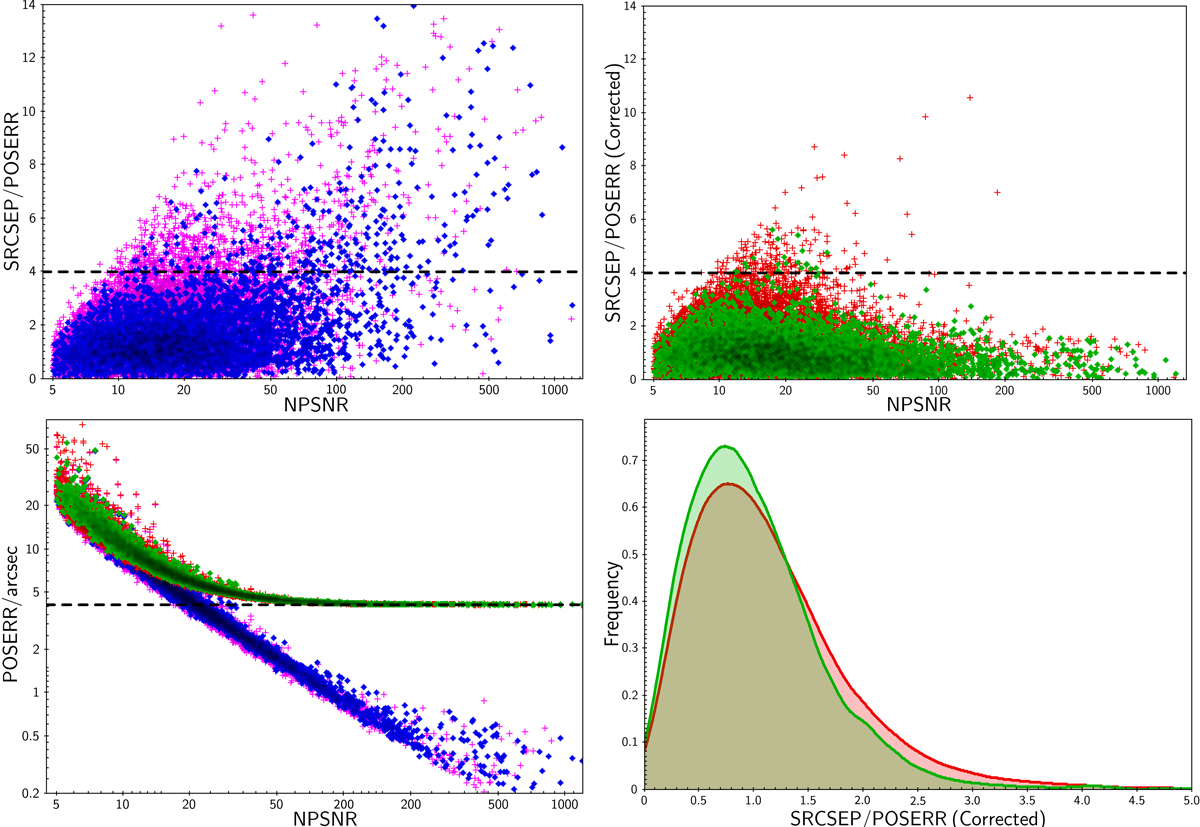
Position-recovery accuracy for a simulation with injection in the “neighbourhood” of PCCS2+2E source locations. Upper left panel: distance between the injection and recovered position, normalized by the estimated uncertainty (POSERR), as a function of NPSNR. The blue points represent the PCCS2 and the magenta the full PCCS2+2E. Upper right panel: same but after applying to POSERR the correction suggested in Eq. (B.3) with ![]() (here green is PCCS2 and red is PCCS2+2E). Lower left panel: POSERR for both sets, corrected and uncorrected, as a function of NPSNR. The horizontal dashed line is the positional precision saturation constant σ0. Lower right panel: histogram of the separation between the injected and estimated source position, normalized by the corrected position error bar. The distribution is consistent with a unitary Rayleigh distributions with a minor excess in the tail.
(here green is PCCS2 and red is PCCS2+2E). Lower left panel: POSERR for both sets, corrected and uncorrected, as a function of NPSNR. The horizontal dashed line is the positional precision saturation constant σ0. Lower right panel: histogram of the separation between the injected and estimated source position, normalized by the corrected position error bar. The distribution is consistent with a unitary Rayleigh distributions with a minor excess in the tail.
Current usage metrics show cumulative count of Article Views (full-text article views including HTML views, PDF and ePub downloads, according to the available data) and Abstracts Views on Vision4Press platform.
Data correspond to usage on the plateform after 2015. The current usage metrics is available 48-96 hours after online publication and is updated daily on week days.
Initial download of the metrics may take a while.