Fig. B.3.
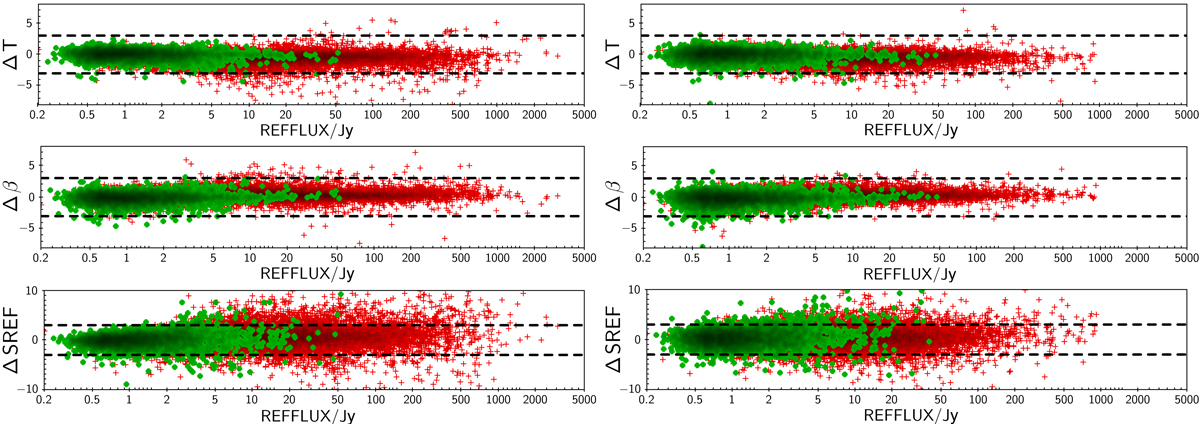
Errors in simulated source properties. The y-axis shows the normalized symmetric error as defined in Eq. (B.1) (Δ) and the x-axis the injected source flux density (REFFLUX). The data set used here is the intersection of the reliability and outliers criteria. The red crosses show all sources, while the green circles are just the PCCS2. The horizontal dashed lines are at y = { − 3, +3}. The panels on the left were drawn when the simulated sources were injected in the same positions as the PCCS2+2E and those on the right for sources injected in their neighbourhood. Those sources whose recovered position moved by more than ![]() (about half a pixel) from the injection location were removed from the set. The total number filtered out was about 0.02% (50 sources) for the case of injection at the same location; for injection in the neighbourhood, the total number filtered out rose to 1.63% (374 sources). The close similarity between the two sets of plots shows that the effect of inpainting is small. Table B.1 contains a statistical analysis summary of these results.
(about half a pixel) from the injection location were removed from the set. The total number filtered out was about 0.02% (50 sources) for the case of injection at the same location; for injection in the neighbourhood, the total number filtered out rose to 1.63% (374 sources). The close similarity between the two sets of plots shows that the effect of inpainting is small. Table B.1 contains a statistical analysis summary of these results.
Current usage metrics show cumulative count of Article Views (full-text article views including HTML views, PDF and ePub downloads, according to the available data) and Abstracts Views on Vision4Press platform.
Data correspond to usage on the plateform after 2015. The current usage metrics is available 48-96 hours after online publication and is updated daily on week days.
Initial download of the metrics may take a while.