Fig. B.2.
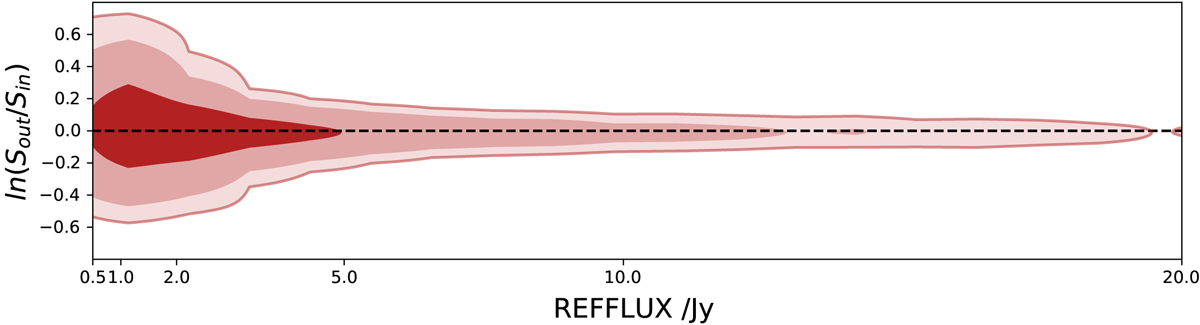
Recovery error versus source brightness. This specifically shows the ln(Sout/Sin) versus Sin distribution contours ([68, 95, 99]%). The sources were injected into the CMB+noise only HEALPix maps following the same process as when injecting into the real data. The same source was injected multiple times to assess the impact of the different background conditions.
Current usage metrics show cumulative count of Article Views (full-text article views including HTML views, PDF and ePub downloads, according to the available data) and Abstracts Views on Vision4Press platform.
Data correspond to usage on the plateform after 2015. The current usage metrics is available 48-96 hours after online publication and is updated daily on week days.
Initial download of the metrics may take a while.