Fig. B.1.
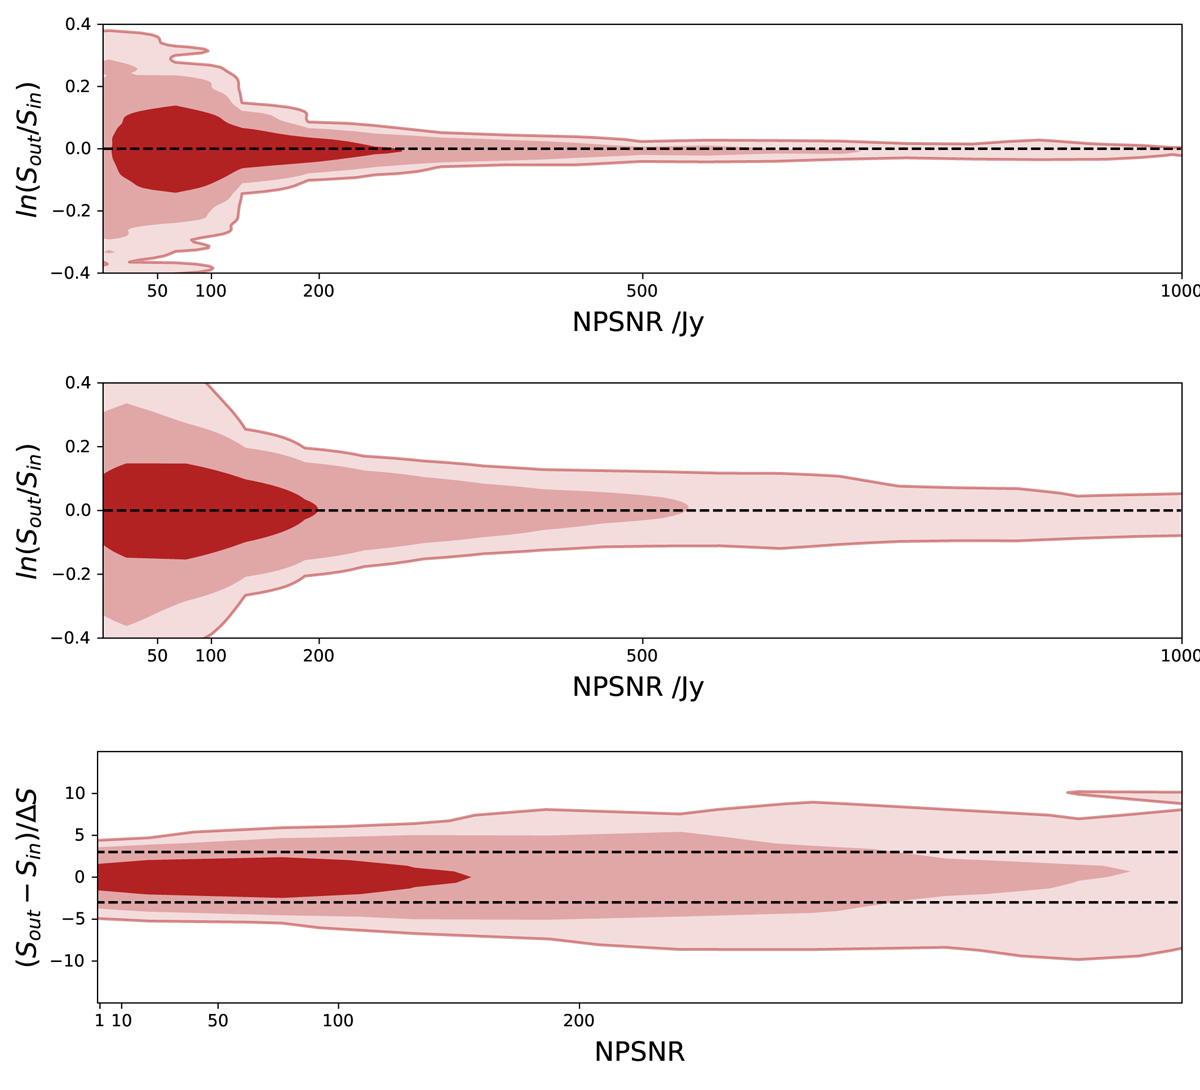
Comparison of input and output flux densities. Upper and middle panels: ln(Sout/Sin) versus NPSNR distribution contours ([68, 95, 99]%). In the upper panel the field and patch are 513 × 513 and 129 × 129 pixels, respectively, and in the middle 129 × 129 and 33 × 33. For both cases a source was directly injected in the central pixel of the patch, but always with a small random shift from the pixel centre. Lower panel: “normalized error” =(Sout − Sin)/ΔS distribution contours for the small patches. The horizontal lines in the bottom panel, are the ±3 σ boundaries.
Current usage metrics show cumulative count of Article Views (full-text article views including HTML views, PDF and ePub downloads, according to the available data) and Abstracts Views on Vision4Press platform.
Data correspond to usage on the plateform after 2015. The current usage metrics is available 48-96 hours after online publication and is updated daily on week days.
Initial download of the metrics may take a while.