Fig. A.3.
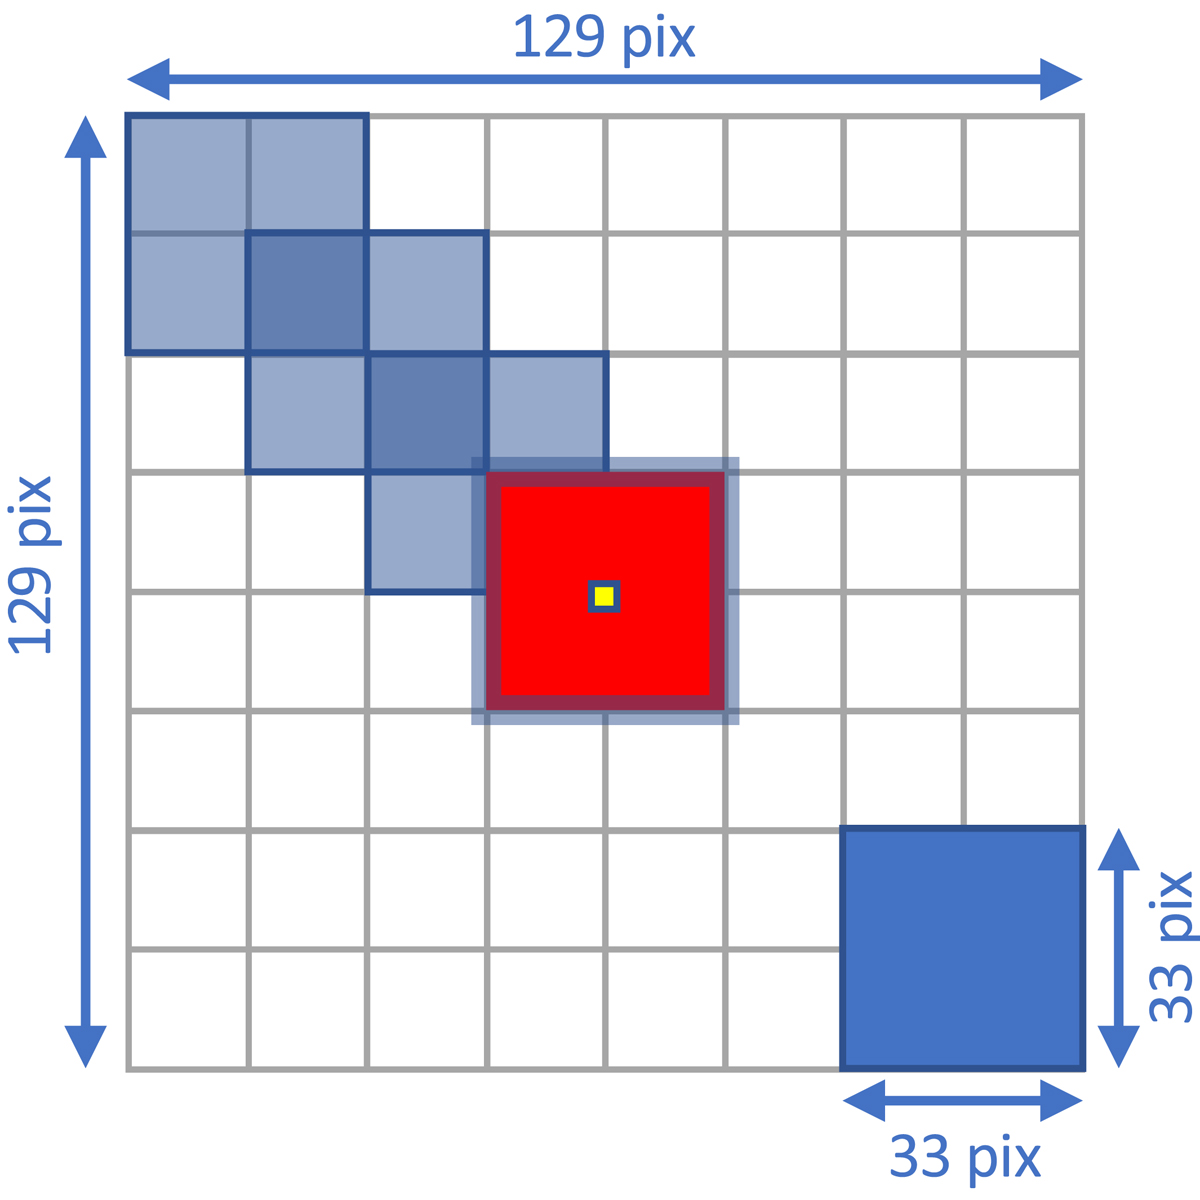
Schematic (not drawn to scale) showing parts of a flat “field” (129 × 129 pixels). The covariance matrix is computed at each of the large squares, or “patches” (33 × 33 pixels), from the “background” map, and then averaged over them. There are 49 overlapping patches (7 × 7) in each field. These are laid out as shown in the figure. The full likelihood is only evaluated at the interior of the central patch (in red with the PCCS2+2E position at its centre, in yellow). The RELTH statistic is then estimated using the pixels of the red region, leaving a border of four pixels. The field/patch Y and X directions, at the centre of the field, match the Galactic coordinate lines of constant latitude and longitude, respectively. Each individual pixel (not drawn) is ![]() .
.
Current usage metrics show cumulative count of Article Views (full-text article views including HTML views, PDF and ePub downloads, according to the available data) and Abstracts Views on Vision4Press platform.
Data correspond to usage on the plateform after 2015. The current usage metrics is available 48-96 hours after online publication and is updated daily on week days.
Initial download of the metrics may take a while.