Fig. A.2.
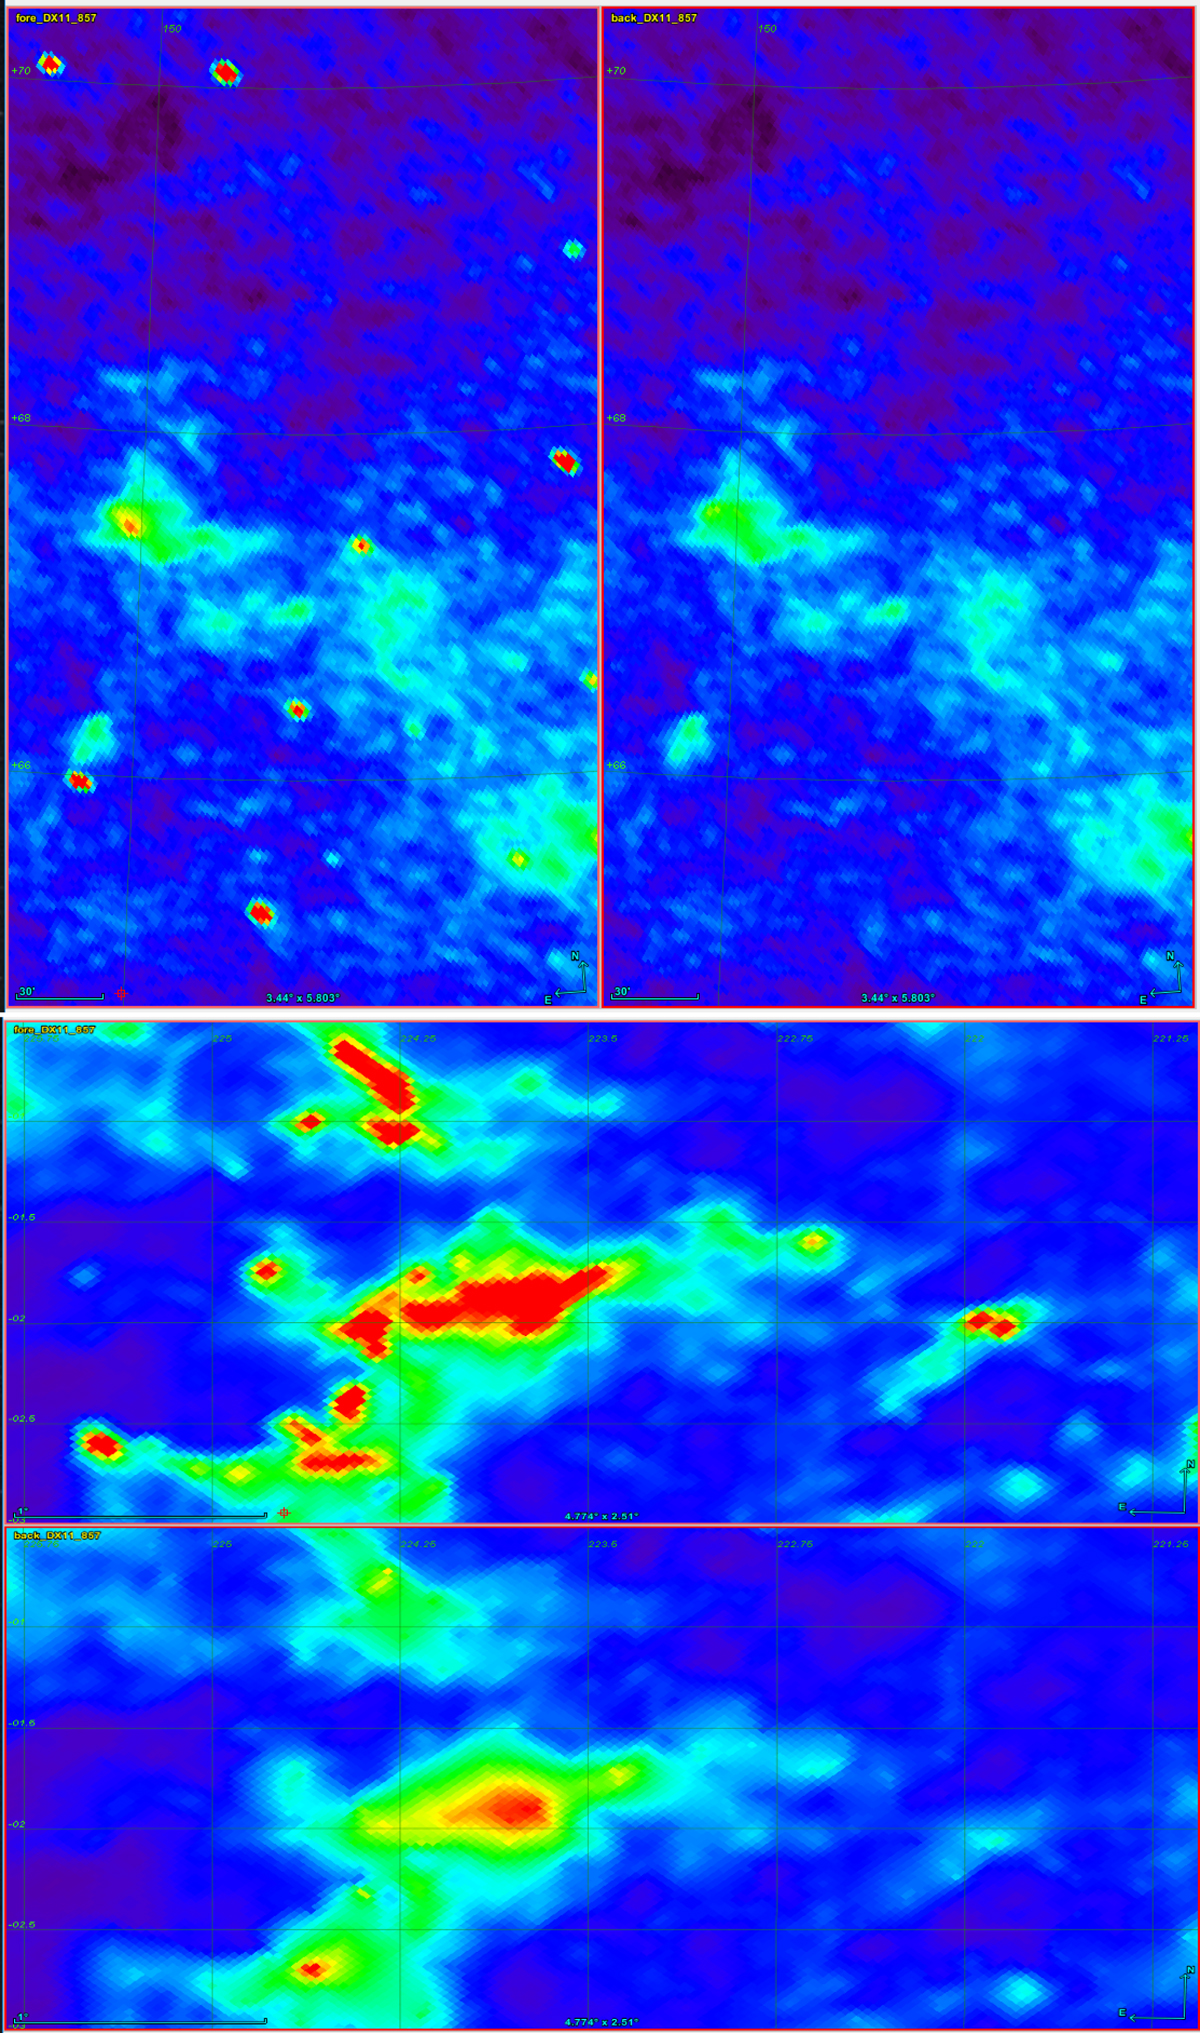
Masking and inpainting effects. Each of the top panels shows a small (![]() ) high Galactic latitude patch cut from Planck’s 857 GHz map. The brightness-colour mapping is the same for both panels. The left panel is from the foreground map and the right from the background. For this low spatial density field, the “mask+inpaint” method recovers the background brightness map very accurately. The two lower panels, with foreground above and background below, show a very bright low Galactic latitude region (
) high Galactic latitude patch cut from Planck’s 857 GHz map. The brightness-colour mapping is the same for both panels. The left panel is from the foreground map and the right from the background. For this low spatial density field, the “mask+inpaint” method recovers the background brightness map very accurately. The two lower panels, with foreground above and background below, show a very bright low Galactic latitude region (![]() ). In this region of high spatial density of sources the “mask+inpaint” process is much less accurate and some degradation of the background can be seen.
). In this region of high spatial density of sources the “mask+inpaint” process is much less accurate and some degradation of the background can be seen.
Current usage metrics show cumulative count of Article Views (full-text article views including HTML views, PDF and ePub downloads, according to the available data) and Abstracts Views on Vision4Press platform.
Data correspond to usage on the plateform after 2015. The current usage metrics is available 48-96 hours after online publication and is updated daily on week days.
Initial download of the metrics may take a while.