Fig. 3.
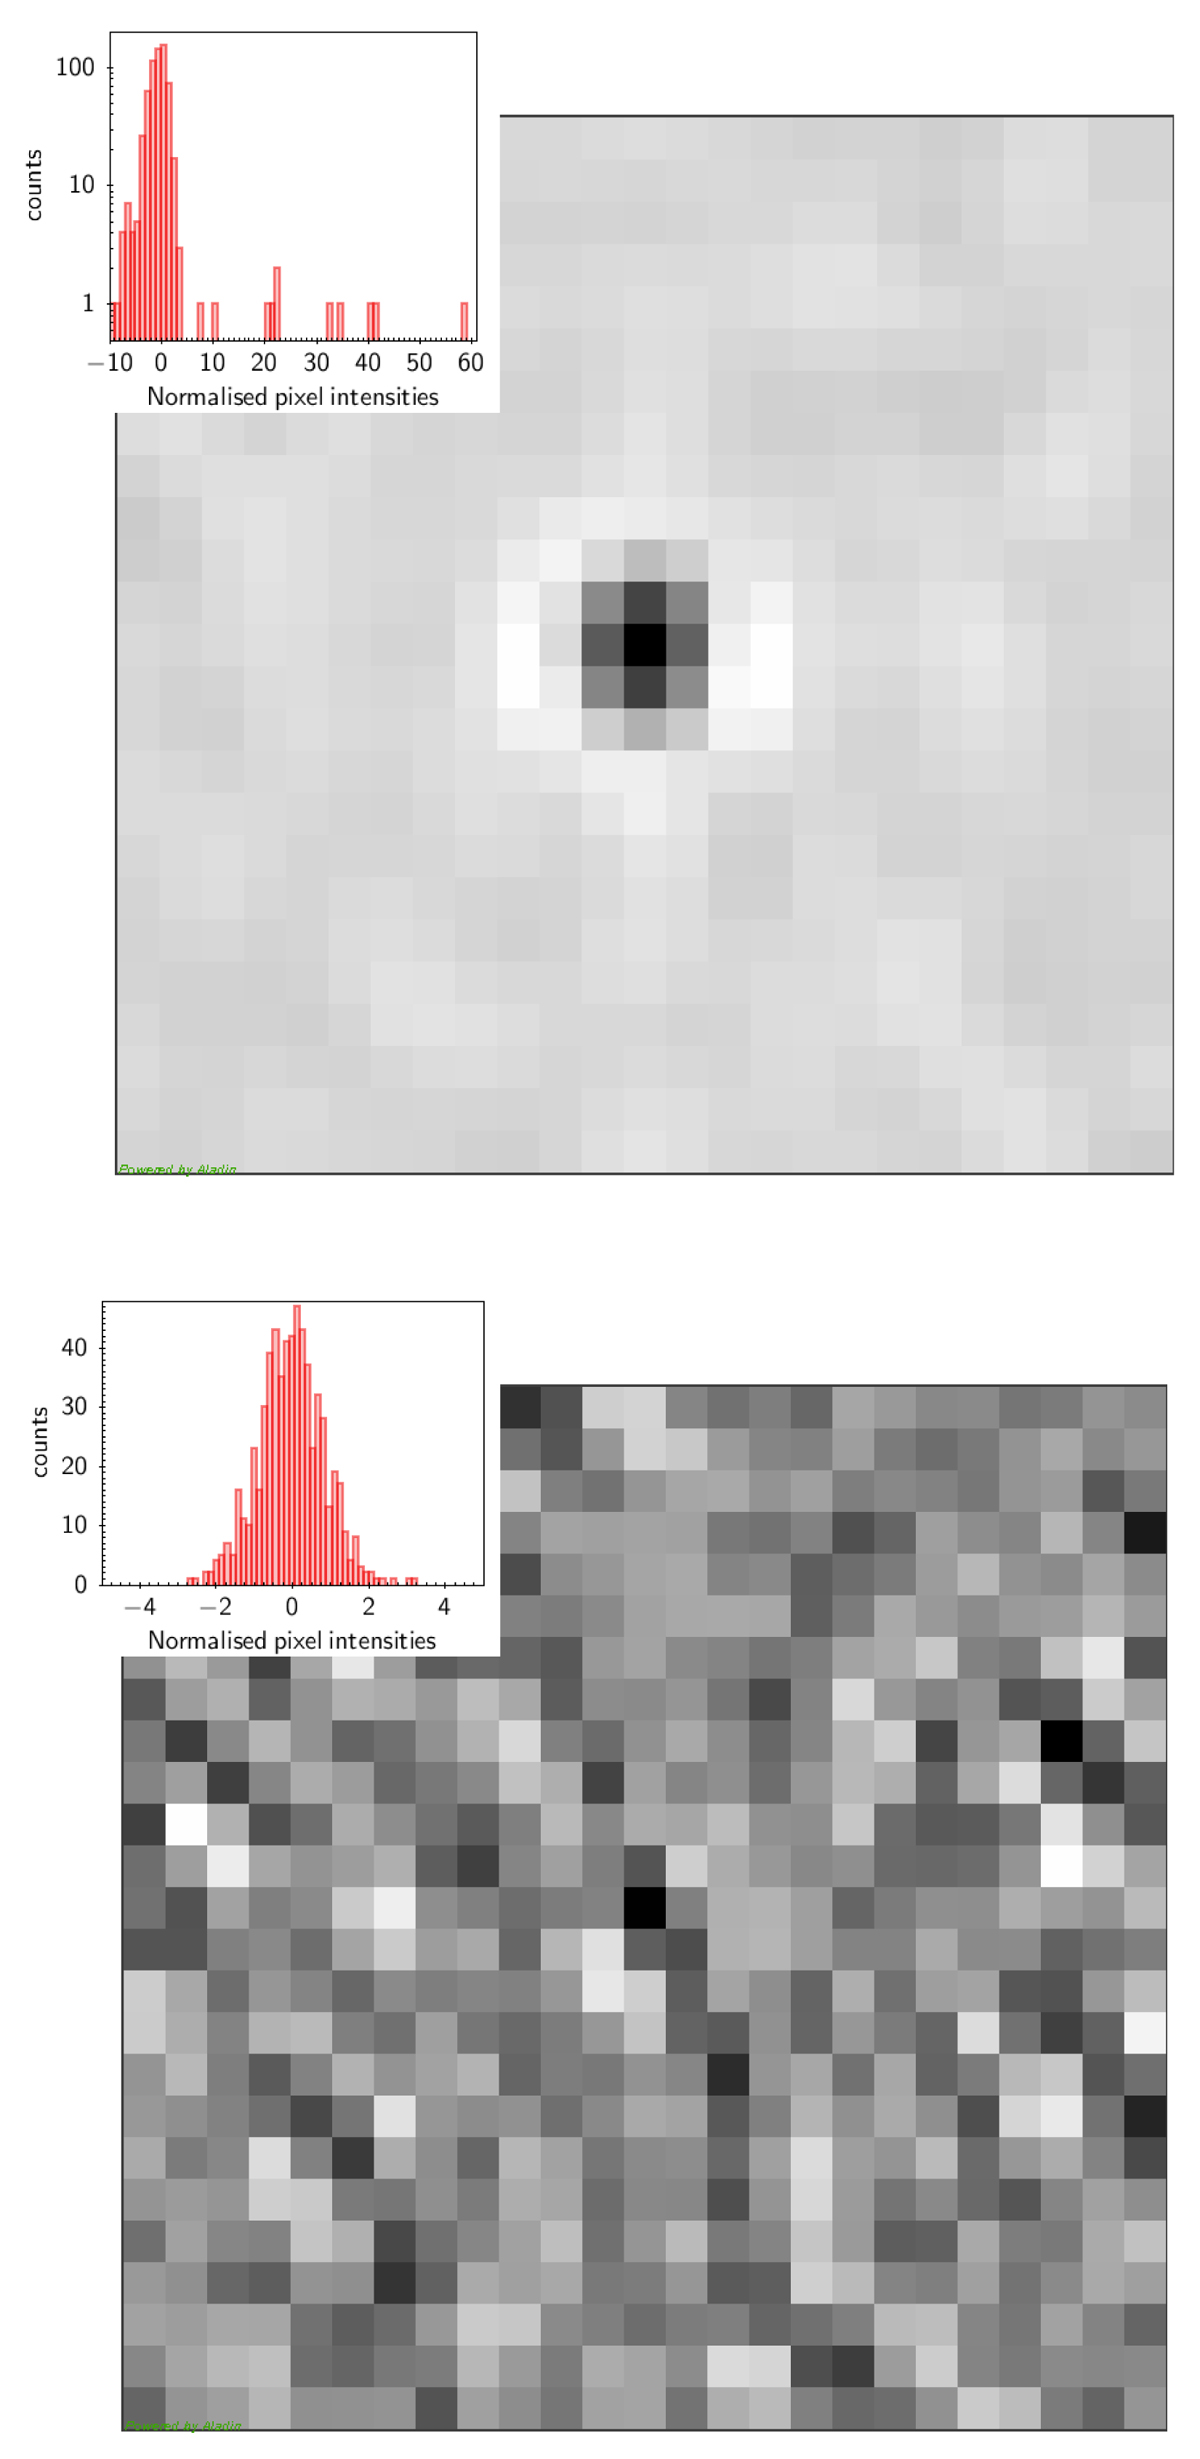
Examples of potential analysis fields. Upper panel: high significance source (PCCS2 857 G172.20+32.04). The histogram (shown in the inset; Y-scale is log) is a mixture of a Gaussian component from the background pixels, plus a strong upper tail generated by the source in the centre. Lower panel: field with no detected sources in it (PCCS2 857 G172.20+32.04; Y-scale is linear). This time only the Gaussian component is present. The tails of the distribution are compatible with “just background”. Each field is 25 × 25 pixels (1 pixel ![]() ). The pixel intensities (Eq. (A.13)) are unitless.
). The pixel intensities (Eq. (A.13)) are unitless.
Current usage metrics show cumulative count of Article Views (full-text article views including HTML views, PDF and ePub downloads, according to the available data) and Abstracts Views on Vision4Press platform.
Data correspond to usage on the plateform after 2015. The current usage metrics is available 48-96 hours after online publication and is updated daily on week days.
Initial download of the metrics may take a while.