Fig. 29.
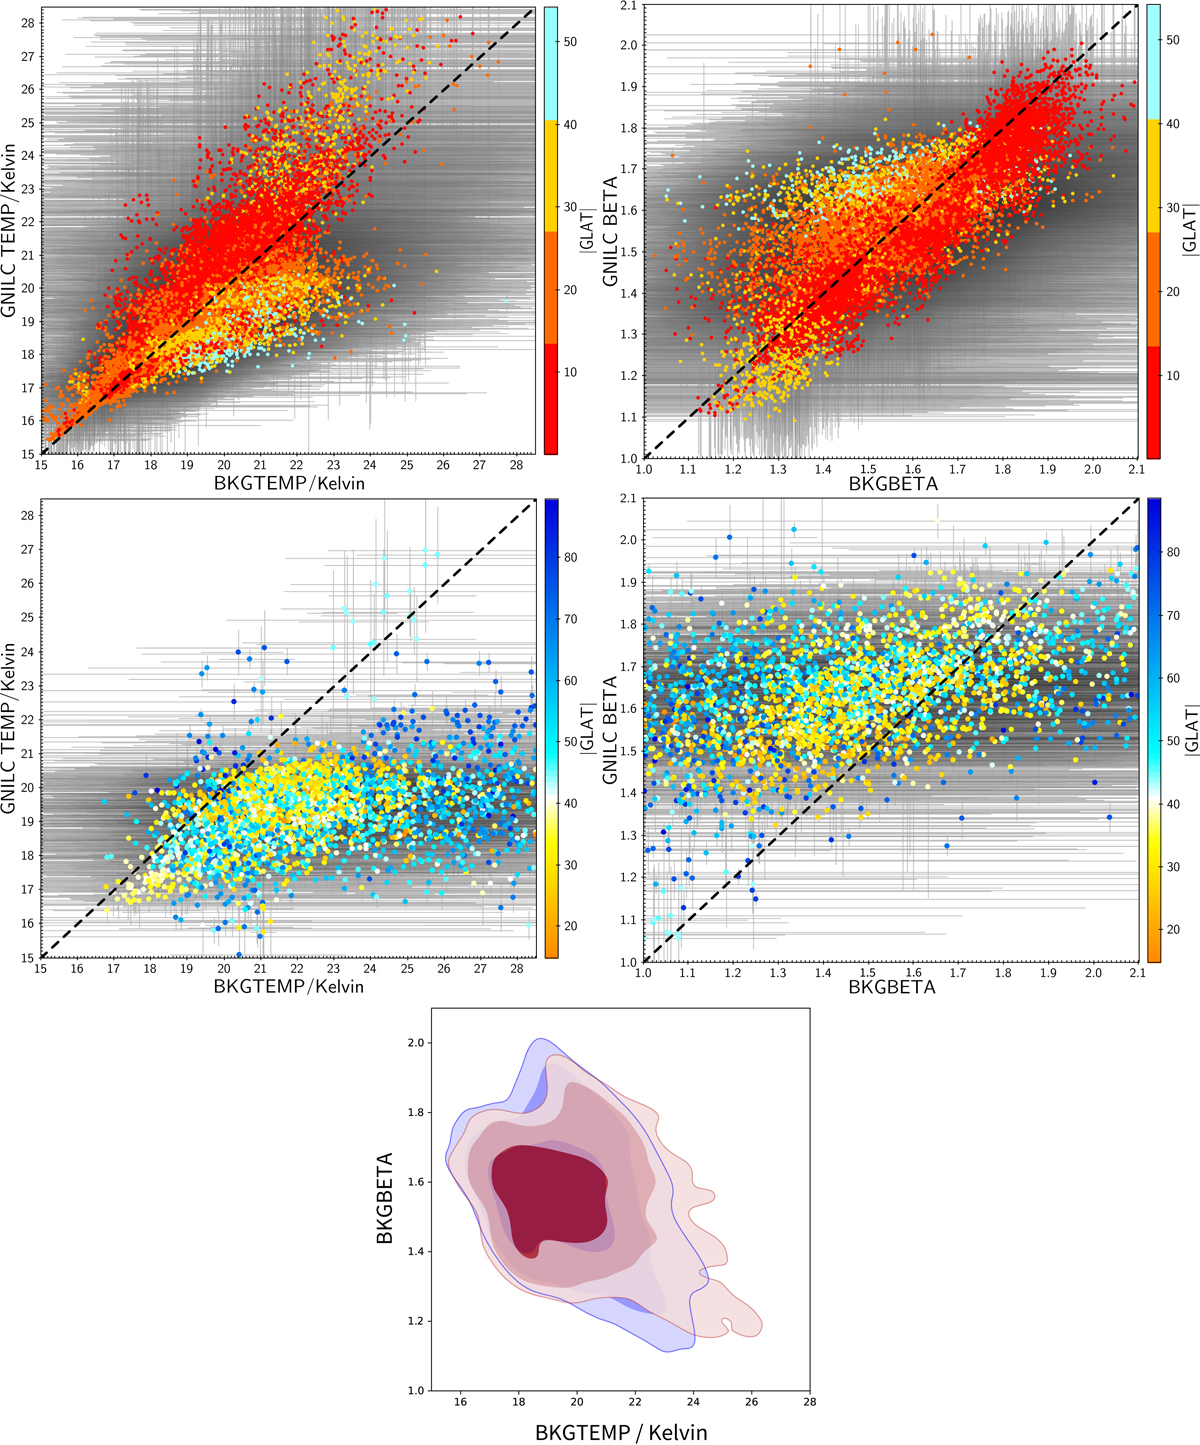
Comparison of background T (left) and β (right) estimates from BeeP and GNILC. The colour of the points indicates the object’s Galactic latitude, with grey lines being 1 σ error bars and the dashed black lines showing equality. Top row: sources inside the PCCS2+2E Galactic mask, i.e., regions with strong dust emission. Middle row: sources in the PCCS2 set, i.e., high-Galactic-latitude, dust-poor regions. Bottom row: same sources as the top row (i.e., inside the PCCS2+2E Galactic mask), but this time their T–β distribution. BeeP distribution contours are shown in blue ([68, 95, 99]%) and GNILC in red.
Current usage metrics show cumulative count of Article Views (full-text article views including HTML views, PDF and ePub downloads, according to the available data) and Abstracts Views on Vision4Press platform.
Data correspond to usage on the plateform after 2015. The current usage metrics is available 48-96 hours after online publication and is updated daily on week days.
Initial download of the metrics may take a while.