Fig. 28.
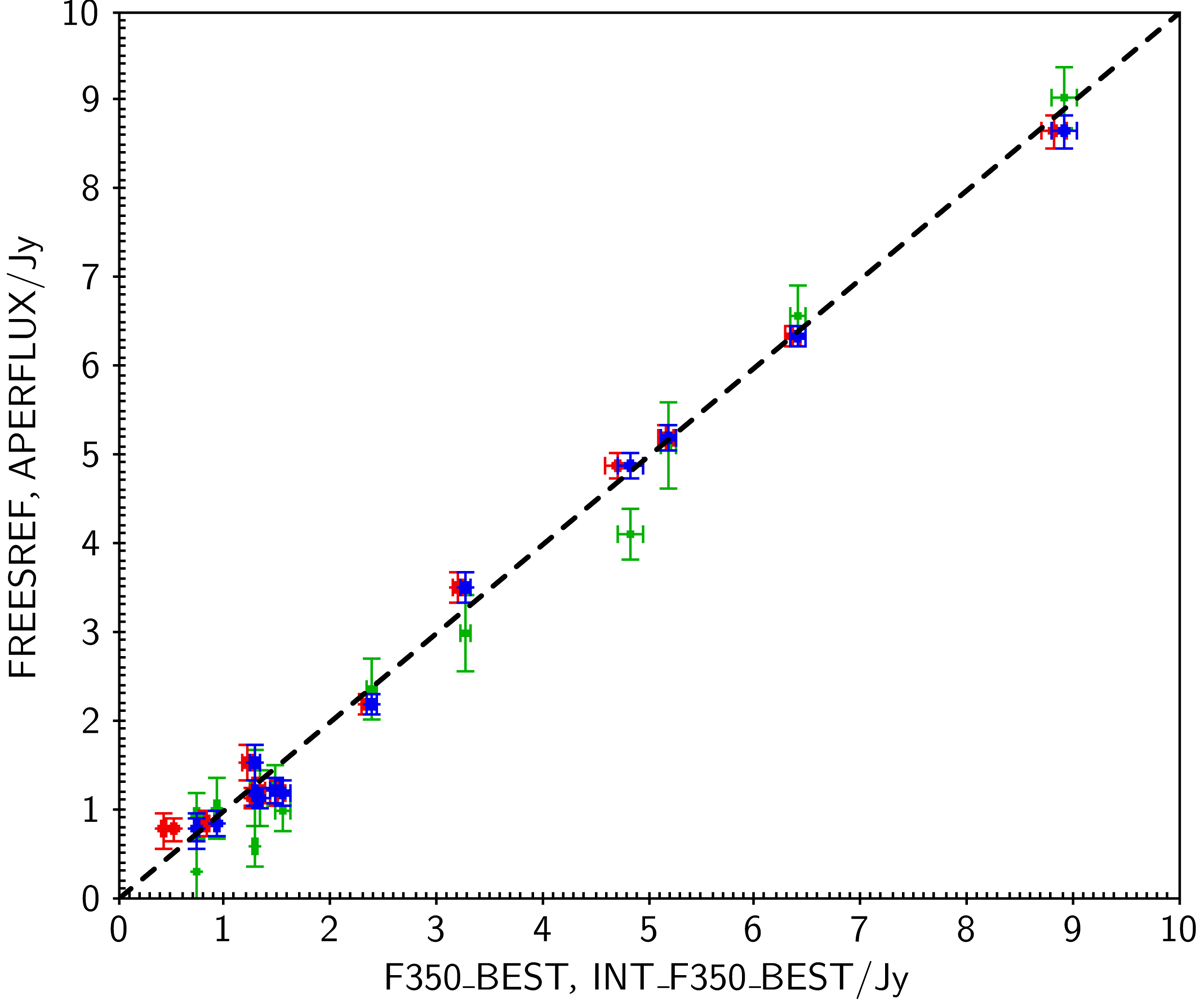
Flux densities (FREESREF) of BeeP sources compared to those (F350_BEST) sources in the Herschel H-ATLAS GAMA15 field catalogue. The brightest H-ATLAS sources within 5′ of the corresponding Planck source are shown in red. The beam-weighted sums of all sources within the corresponding Planck 857 GHz beam are shown in blue. Green symbols give a similar comparison between the Herschel beam-weighted flux-density sum and the PCCS2 APERFLUX flux density. The BeeP errors are not corrected here (see Sect. 6.2.4).
Current usage metrics show cumulative count of Article Views (full-text article views including HTML views, PDF and ePub downloads, according to the available data) and Abstracts Views on Vision4Press platform.
Data correspond to usage on the plateform after 2015. The current usage metrics is available 48-96 hours after online publication and is updated daily on week days.
Initial download of the metrics may take a while.