Fig. 27.
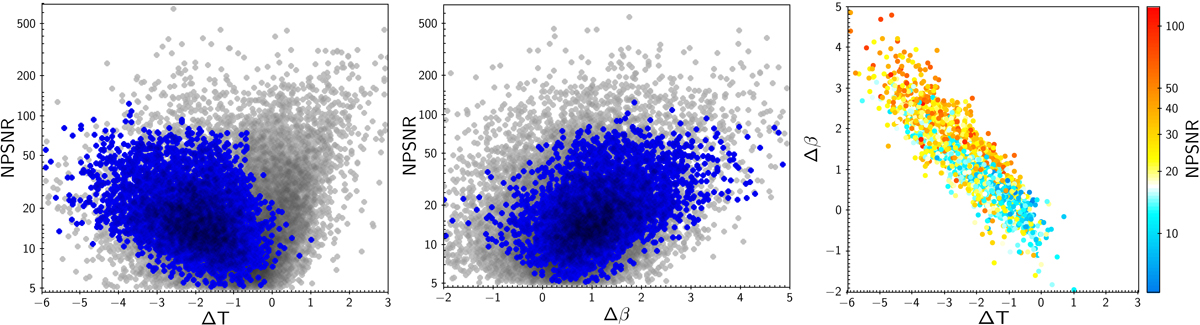
Left and middle: detection significance level NPSNR versus normalized contrast ΔT (left) and Δβ (middle), defined in Eq. (19), for the set of sources in common between the BeeP and GCC catalogues (blue points), and for the entire BeeP/base catalogue (grey points). Correlations are seen for the common subset (shown in blue), but not for the entire BeeP/base catalogue (in grey). Right: ΔT versus (Δβ) for the GCC common sample, with colour showing NPSNR. We see that ΔT and Δβ are highly correlated, and each is also correlated with NPSNR.
Current usage metrics show cumulative count of Article Views (full-text article views including HTML views, PDF and ePub downloads, according to the available data) and Abstracts Views on Vision4Press platform.
Data correspond to usage on the plateform after 2015. The current usage metrics is available 48-96 hours after online publication and is updated daily on week days.
Initial download of the metrics may take a while.