Fig. 24.
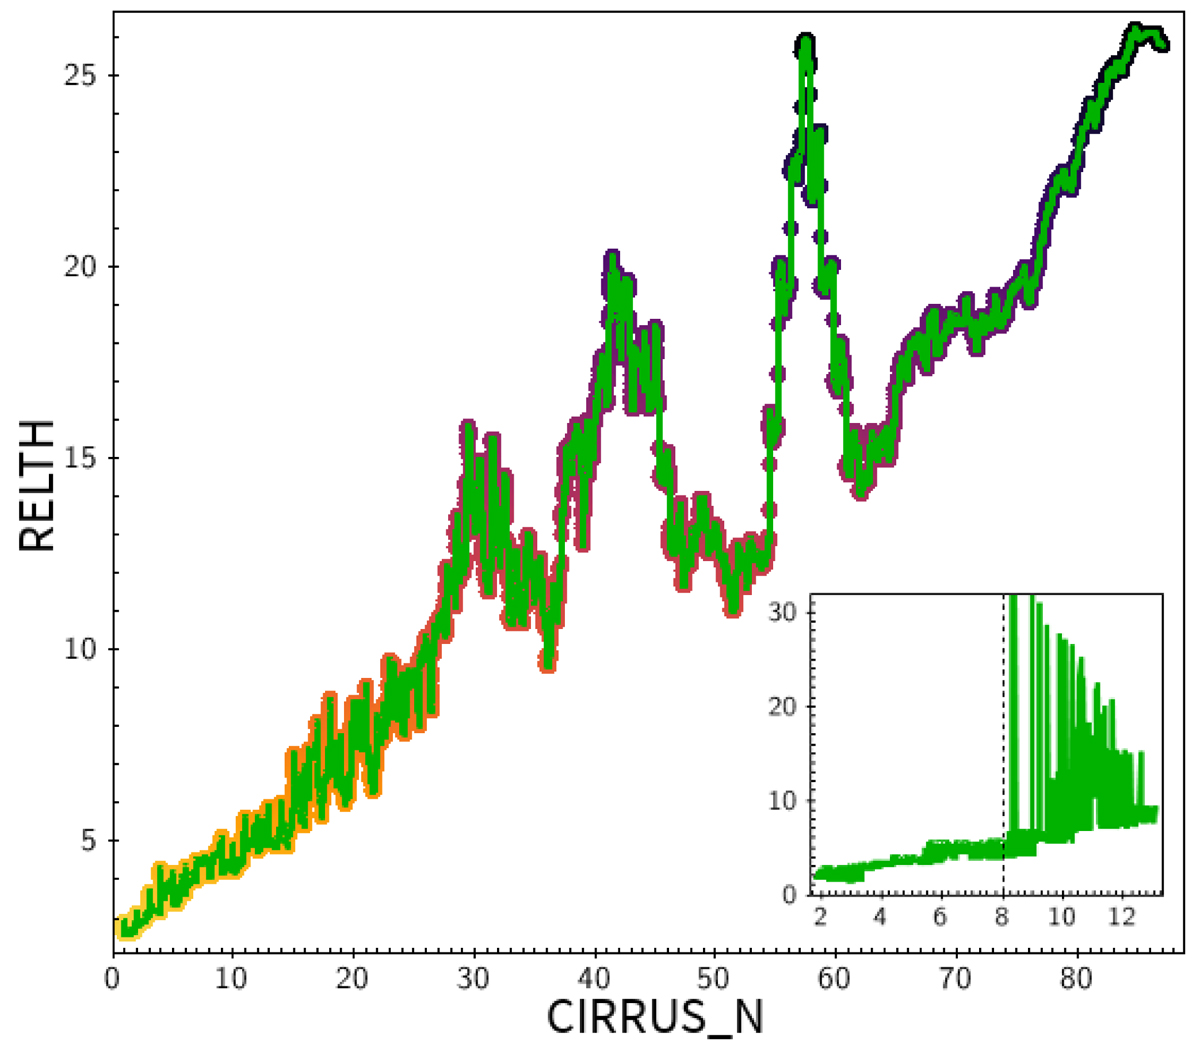
Correlation between the BeePRELTH parameter and the PCCS2+2E CIRRUS_N parameter. Sources in the BeeP catalogue were sorted in ascending order of RELTH. Then a boxcar average with window = 500 was calculated for both RELTH and the corresponding PCCS2+2E CIRRUS_N values. The relationship is particularly tight for low values of the parameters, as seen in the expanded detail window, obtained following the exact same procedure as the main picture but using PCCS2 data only. We also reduced the boxcar window to just 50 samples here. The dashed vertical line is the PCCS2 CIRRUS_N reliability threshold.
Current usage metrics show cumulative count of Article Views (full-text article views including HTML views, PDF and ePub downloads, according to the available data) and Abstracts Views on Vision4Press platform.
Data correspond to usage on the plateform after 2015. The current usage metrics is available 48-96 hours after online publication and is updated daily on week days.
Initial download of the metrics may take a while.