Fig. 22.
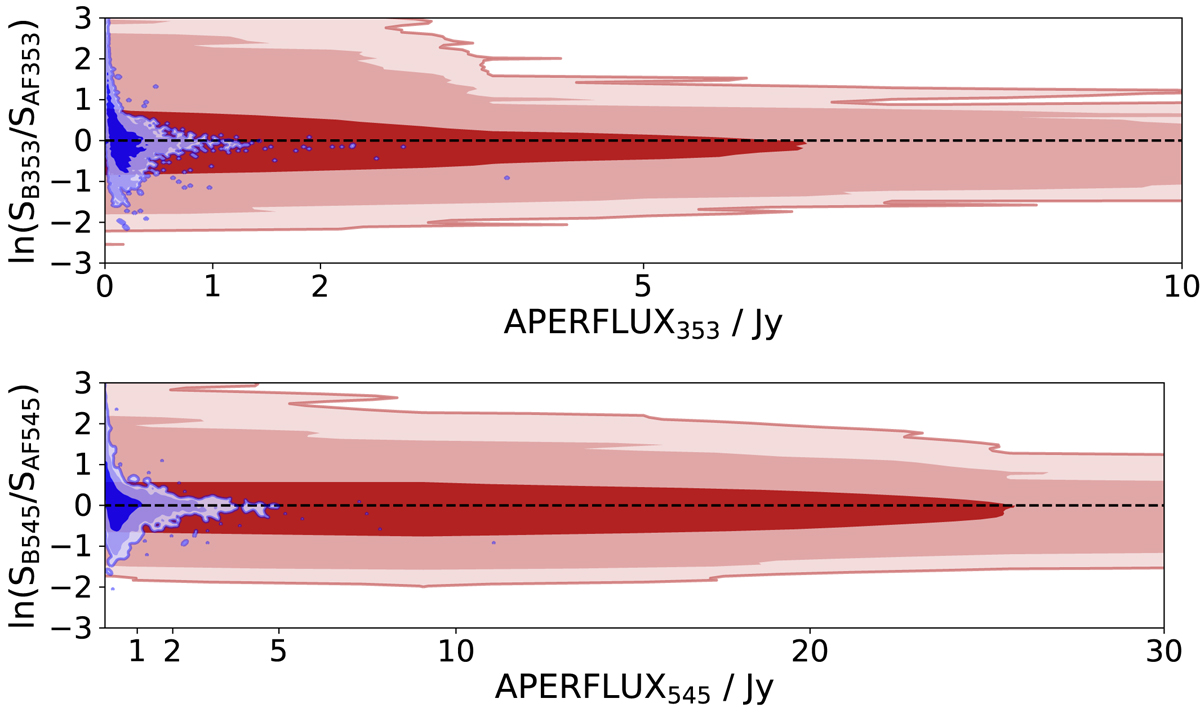
Comparison of BeeP’s Free flux densities at 353 GHz (upper row) and 545 GHz (lower row) with aperture flux-density values (APERFLUX) from PCCS2+2E. The blue contours ([68, 95, 99]%) show the distribution of the PCCS2 subset of sources and the red ones the remaining PCCS2E. Unlike in Fig. 20, BeeP sources whose position shifted by more than one pixel from the original PCCS2+2E and those with EXT ≥ 1.64 pixels (extended) are not included.
Current usage metrics show cumulative count of Article Views (full-text article views including HTML views, PDF and ePub downloads, according to the available data) and Abstracts Views on Vision4Press platform.
Data correspond to usage on the plateform after 2015. The current usage metrics is available 48-96 hours after online publication and is updated daily on week days.
Initial download of the metrics may take a while.