Fig. 21.
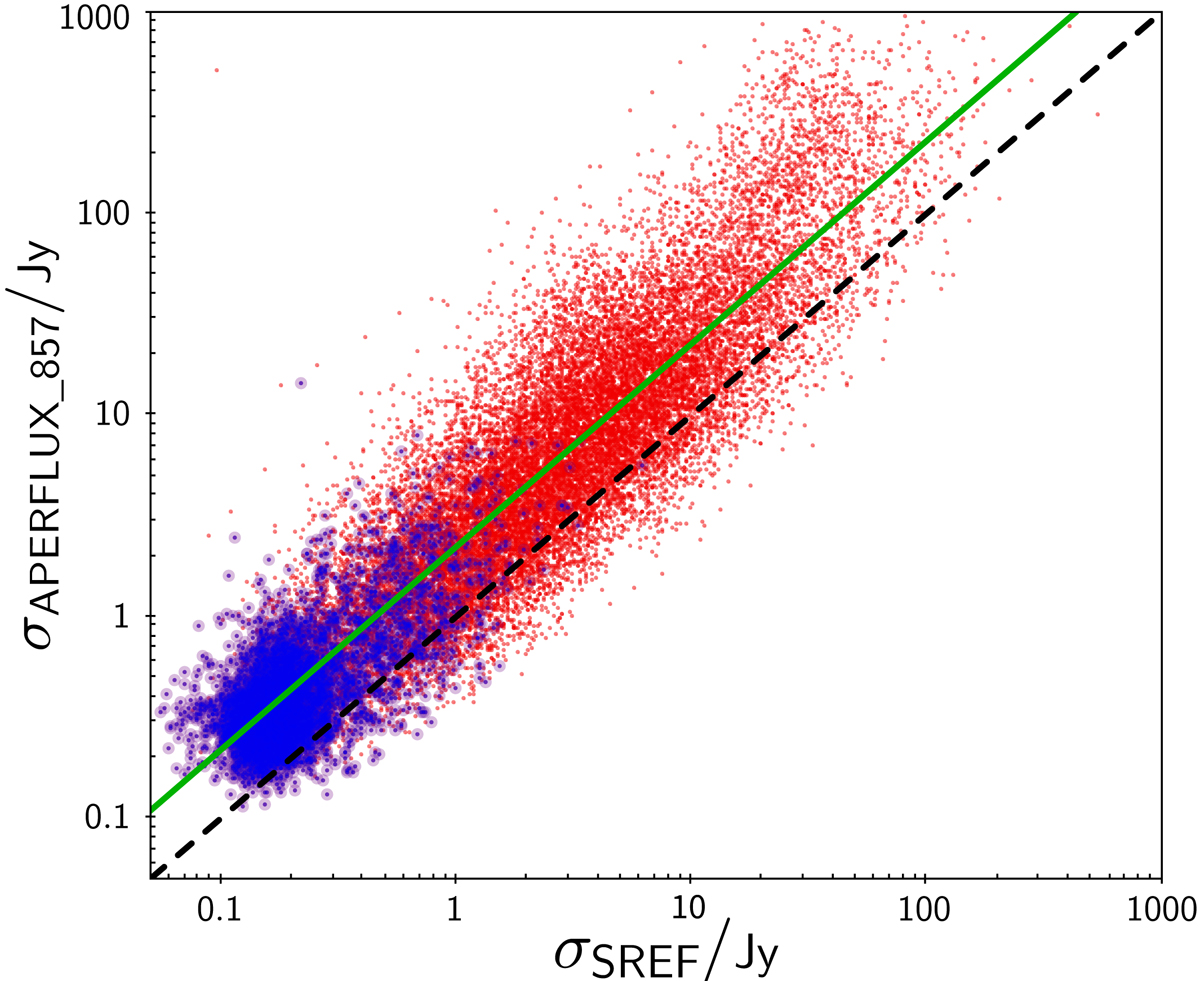
Comparison of the uncertainty determined in PCCS2+2E (red markers), and the PCCS2 (blue markers), on the aperture flux density at 857 GHz (APERFLUX_857) to the uncertainty on the reference flux density as obtained by BeeP (SREF). The black dashed line represents equality, and the green solid line is the best fit, which has a slope very close to 2 (actually 2.2).
Current usage metrics show cumulative count of Article Views (full-text article views including HTML views, PDF and ePub downloads, according to the available data) and Abstracts Views on Vision4Press platform.
Data correspond to usage on the plateform after 2015. The current usage metrics is available 48-96 hours after online publication and is updated daily on week days.
Initial download of the metrics may take a while.