Fig. 20.
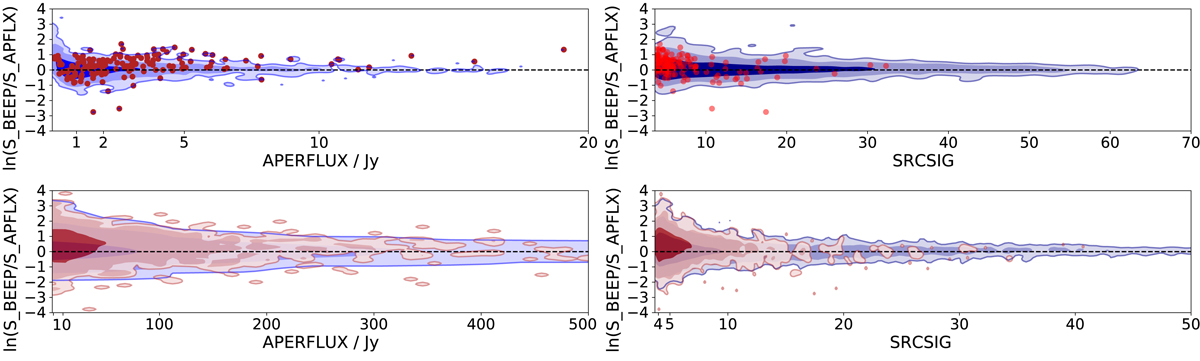
Comparison of BeeP’s Free flux densities at 857 GHz with aperture flux-density values (APERFLUX) from PCCS2+2E. We plot ln(SBeeP/SAPERFLUX) against APERFLUX (left) and SRCSIG (right). Upper row: distribution of the PCCS2 values in blue (contours are [68, 95, 99]%). The red dots are sources that moved by more than one pixel from the original PCCS2+2E position. Lower row: full PCCS2+2E. The red contours represent the distribution of sources that moved by more than one pixel, and the blue ones the remaining population. Top row: we show individual dots because there are too few of them to make a density plot.
Current usage metrics show cumulative count of Article Views (full-text article views including HTML views, PDF and ePub downloads, according to the available data) and Abstracts Views on Vision4Press platform.
Data correspond to usage on the plateform after 2015. The current usage metrics is available 48-96 hours after online publication and is updated daily on week days.
Initial download of the metrics may take a while.