Free Access
Fig. 2.
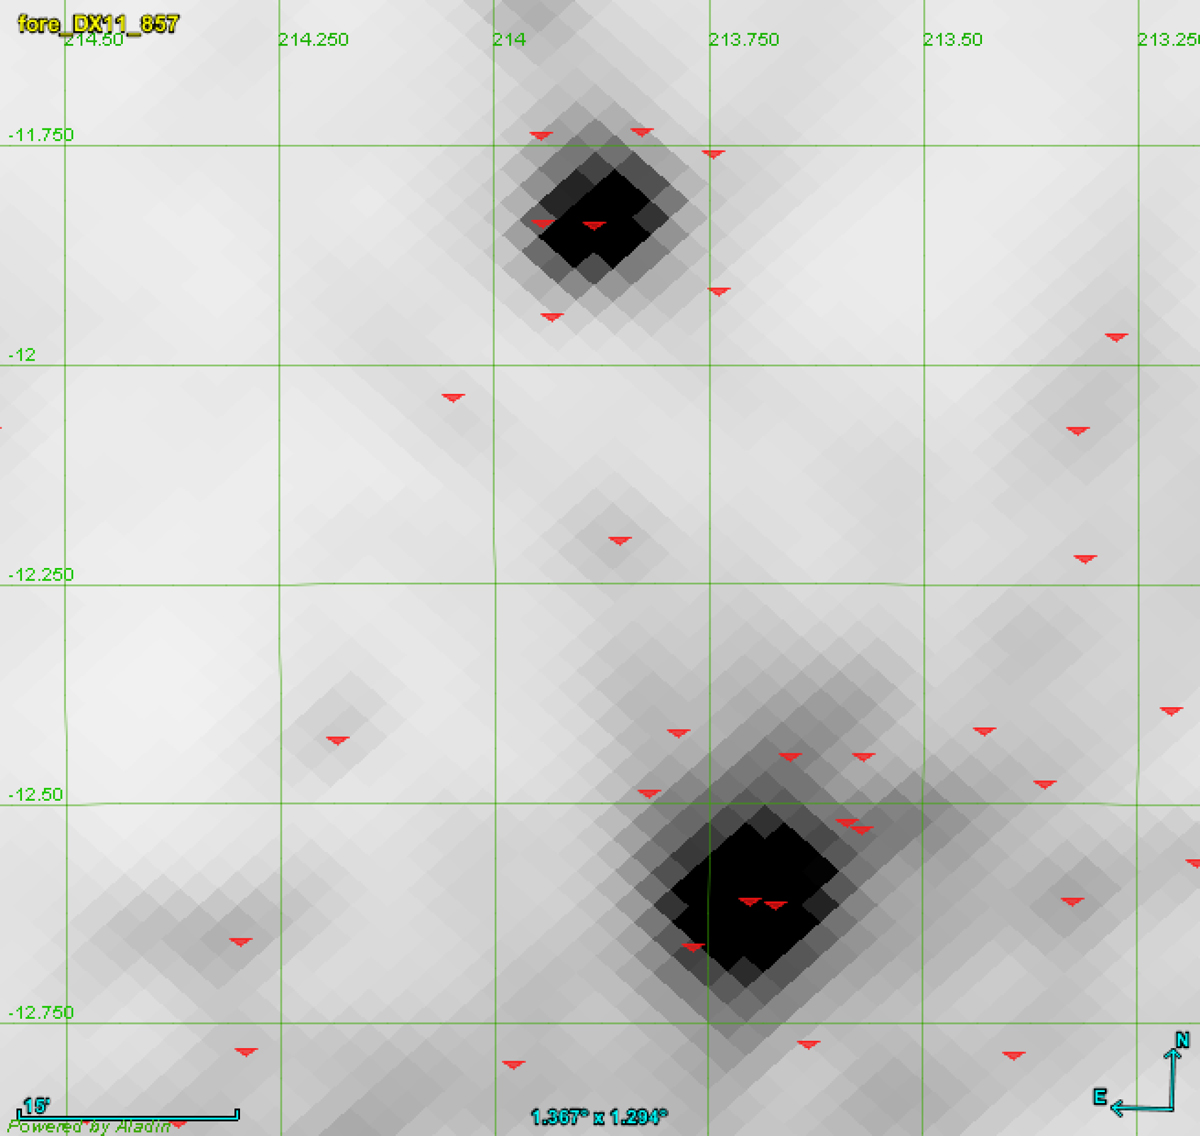
Small patch (![]() ) taken from the Planck 857 GHz map. The red triangles are PCCS2+2E catalogue positions. One can see that around the two bright “blobs” there are many associated PCCS2+2E sources, but their locations do not reflect the actual brightness peaks.
) taken from the Planck 857 GHz map. The red triangles are PCCS2+2E catalogue positions. One can see that around the two bright “blobs” there are many associated PCCS2+2E sources, but their locations do not reflect the actual brightness peaks.
Current usage metrics show cumulative count of Article Views (full-text article views including HTML views, PDF and ePub downloads, according to the available data) and Abstracts Views on Vision4Press platform.
Data correspond to usage on the plateform after 2015. The current usage metrics is available 48-96 hours after online publication and is updated daily on week days.
Initial download of the metrics may take a while.