Fig. 19.
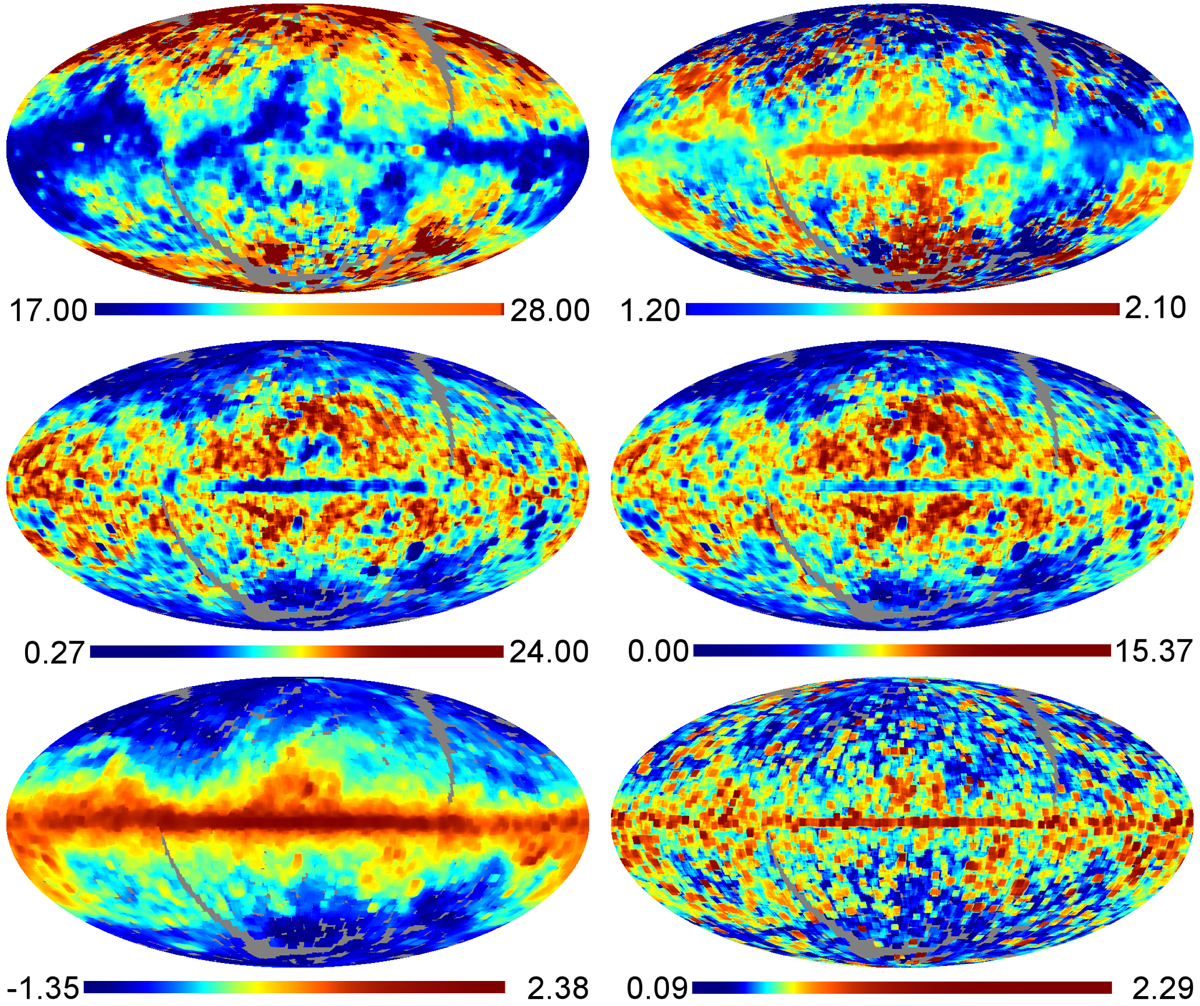
Top: MBB parameters fitted to the background, with T(K) on the left and β on the right. The high-temperature region at (l = 155° ;b = 77°) is artificially created by strong artefacts in the IRIS data. Middle: inverse relative uncertainty T/ΔT (left) and β/Δβ (right) of the MBB parameters. Bottom left: reference background brightness, log(Jy pixel−1, evaluated at 857 GHz. This is the value at 857 GHz of a multifrequency fit, not the value directly measured at 857 GHz. Bottom right: log(RELTH), computed with α = 5% (see Eq. (9)). On all panels there is a region at (l = 208° ;b = −18°) of extreme values and uncertainties caused by artefacts present in the IRIS data. The colour bars have been histogram-equalized. regions are either inside the IRIS mask, or had insufficient data.
Current usage metrics show cumulative count of Article Views (full-text article views including HTML views, PDF and ePub downloads, according to the available data) and Abstracts Views on Vision4Press platform.
Data correspond to usage on the plateform after 2015. The current usage metrics is available 48-96 hours after online publication and is updated daily on week days.
Initial download of the metrics may take a while.