Fig. 17.
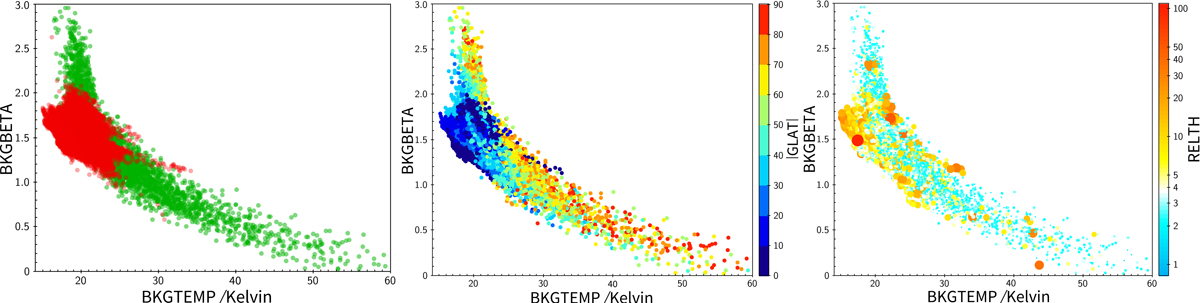
Three views of the relationship between T and β for the background, from the MBB model. Left: PCCS2 background regions, which are at high Galactic latitude, are in green. PCCS2E Galactic mask regions, which have strong, dominant dust emission, are in red. Middle: colours show Galactic latitude. Right: colours show RELTH, a measure of the non-Gaussianity of the patch. The symbol size here is proportional to RELTH.
Current usage metrics show cumulative count of Article Views (full-text article views including HTML views, PDF and ePub downloads, according to the available data) and Abstracts Views on Vision4Press platform.
Data correspond to usage on the plateform after 2015. The current usage metrics is available 48-96 hours after online publication and is updated daily on week days.
Initial download of the metrics may take a while.