Fig. 13.
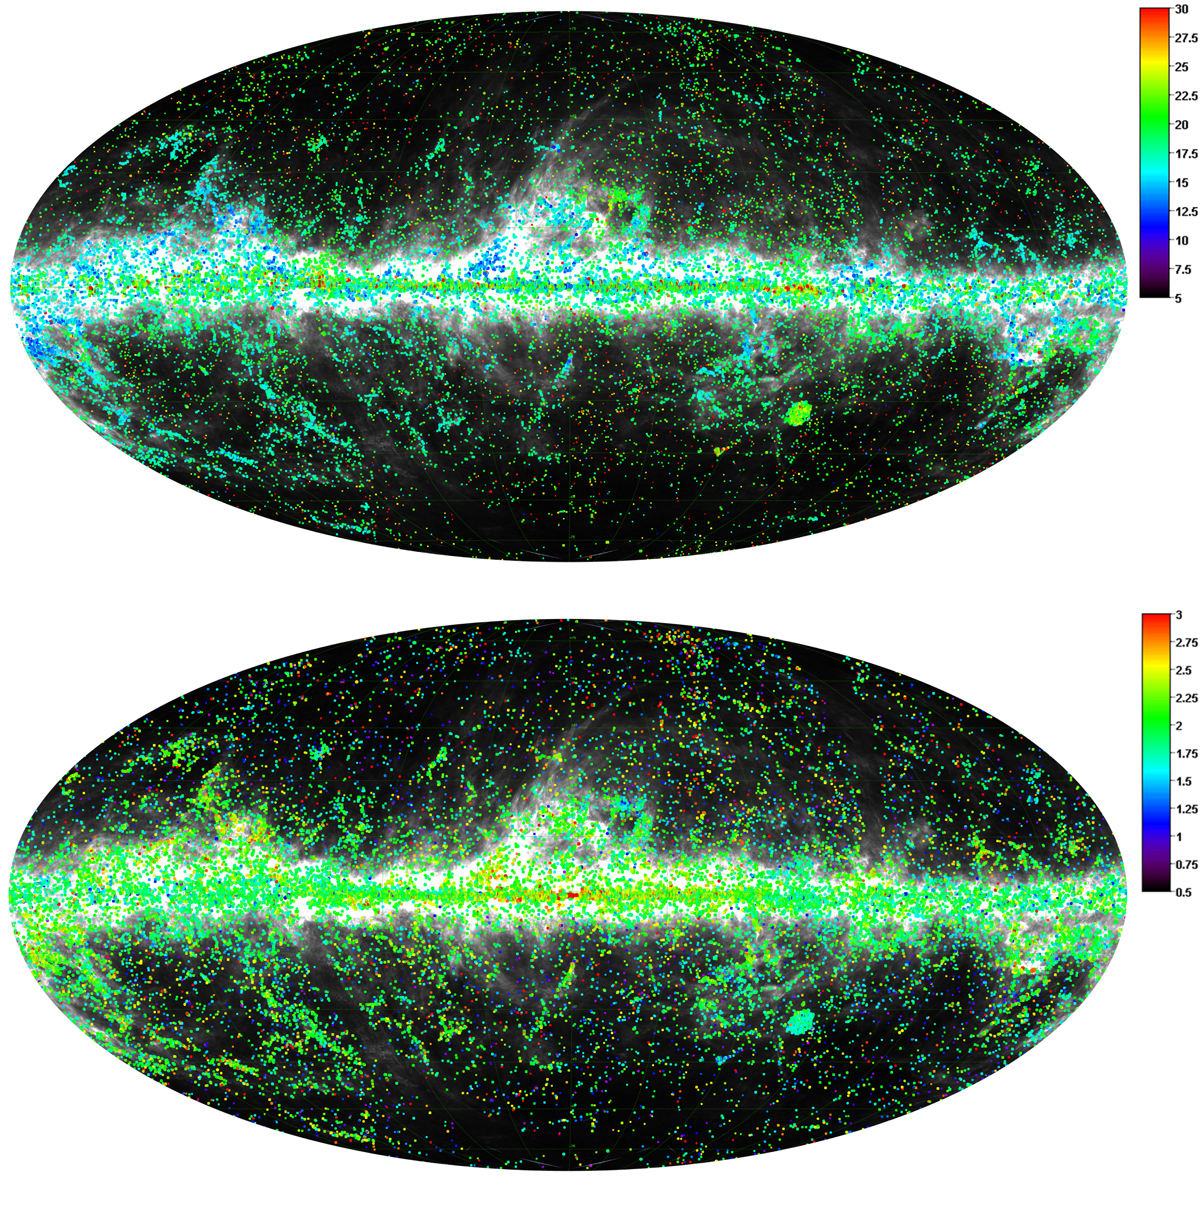
Top: temperatures of sources in the catalogue (colour scale in thermodynamic kelvins). Bottom: spectral indices β of the MBB SED model. The catalogue was filtered using the condition of Eq. (16). The size of each circle representing an object is proportional to the logarithm of the source flux density in janskys. This figure also makes clear the extent that sources in PCCS2+2E trace cirrus; see also the smaller region in Fig. 1.
Current usage metrics show cumulative count of Article Views (full-text article views including HTML views, PDF and ePub downloads, according to the available data) and Abstracts Views on Vision4Press platform.
Data correspond to usage on the plateform after 2015. The current usage metrics is available 48-96 hours after online publication and is updated daily on week days.
Initial download of the metrics may take a while.