Fig. 11.
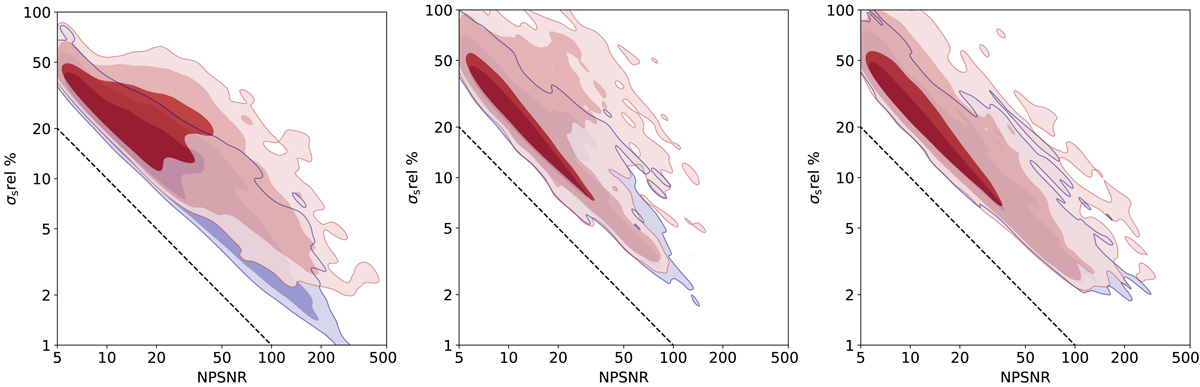
Flux density uncertainties (![]() , see Eq. (17), as a percentage) versus NPSNR. Blue contours ([68,95,99]%) show the distribution of uncorrected values (as presented in the catalogue), while red contours show the distribution of values after the corrections suggested in Appendix B.2. Left panel: sources in the PCCS2, middle panel: PCCS2E with Galactic latitude greater than 10°, and right panel: sources close to the Galactic plane, with b ≤ 10°. For reference, we show NPSNR−1 (black dashed line), the theoretical lower boundary for
, see Eq. (17), as a percentage) versus NPSNR. Blue contours ([68,95,99]%) show the distribution of uncorrected values (as presented in the catalogue), while red contours show the distribution of values after the corrections suggested in Appendix B.2. Left panel: sources in the PCCS2, middle panel: PCCS2E with Galactic latitude greater than 10°, and right panel: sources close to the Galactic plane, with b ≤ 10°. For reference, we show NPSNR−1 (black dashed line), the theoretical lower boundary for ![]() , which can only be achieved if flux density is the sole parameter in the model.
, which can only be achieved if flux density is the sole parameter in the model.
Current usage metrics show cumulative count of Article Views (full-text article views including HTML views, PDF and ePub downloads, according to the available data) and Abstracts Views on Vision4Press platform.
Data correspond to usage on the plateform after 2015. The current usage metrics is available 48-96 hours after online publication and is updated daily on week days.
Initial download of the metrics may take a while.