Fig. 1.
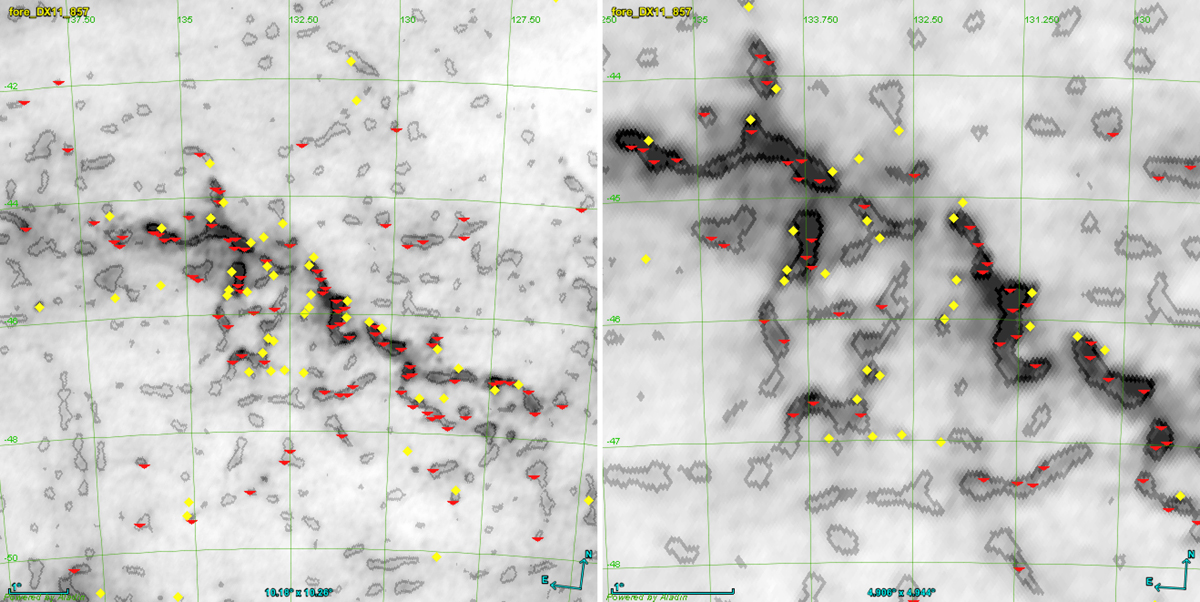
Left: a 10° × 10° mid-Galactic-latitude (bII ≈ 45°) region of the Planck 857 GHz map superimposed on the PCCS2+2E filament mask (grey contours). PCCS2 sources are yellow diamonds and PCCS2E sources are red triangles. The selected region contains complex backgrounds with localized features such as filaments and cirrus, causing the mask to break up into numerous islands. Many PCCS2+2E sources trace these structures, suggesting that some of the sources are parts of filamentary structures broken up by the source-finder and not genuine compact sources. Right: central 4.9° × 4.9° of the picture on the left, showing more clearly the spatial distribution of the PCCS2 and PCCS2E sources relative to the mask.
Current usage metrics show cumulative count of Article Views (full-text article views including HTML views, PDF and ePub downloads, according to the available data) and Abstracts Views on Vision4Press platform.
Data correspond to usage on the plateform after 2015. The current usage metrics is available 48-96 hours after online publication and is updated daily on week days.
Initial download of the metrics may take a while.