Fig. D.1.
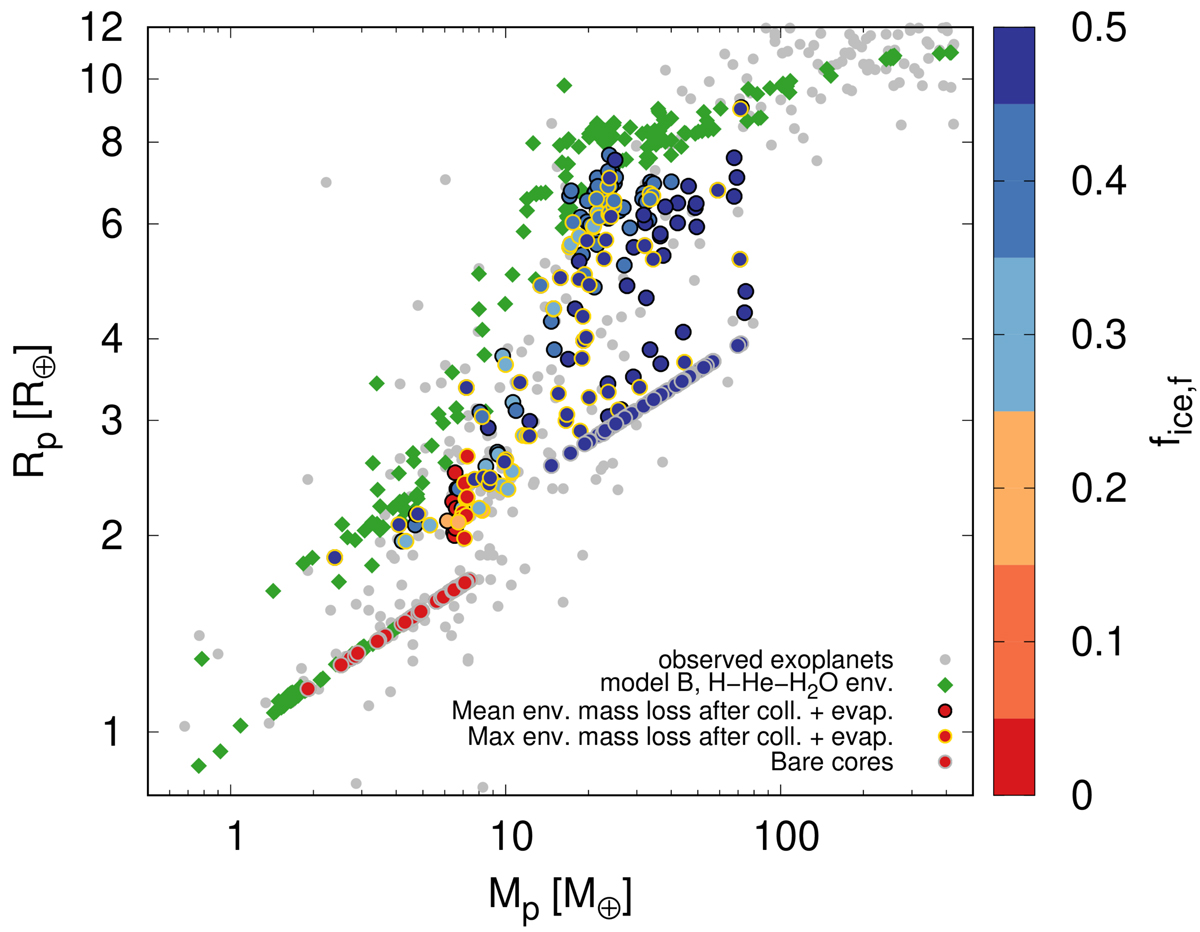
Same as Fig. 5, but showing only model B from that figure (green diamonds), plus the results of hypothetical giant impacts followed by photoevaporation (coloured circles). The colour-bar represents the final water mass fraction. The grey dots represent the observed exoplanet population as in Fig. 5. The yellow-bordered circles represent the planets that underwent the maximum envelope mass-loss due to a collision, and the black-bordered circles represent the mean values of envelope mass-loss for each family of collisions. The grey-bordered circles denote the bare cores that lost their envelopes completely either just after the collision or after photoevaporation.
Current usage metrics show cumulative count of Article Views (full-text article views including HTML views, PDF and ePub downloads, according to the available data) and Abstracts Views on Vision4Press platform.
Data correspond to usage on the plateform after 2015. The current usage metrics is available 48-96 hours after online publication and is updated daily on week days.
Initial download of the metrics may take a while.