Fig. 4.
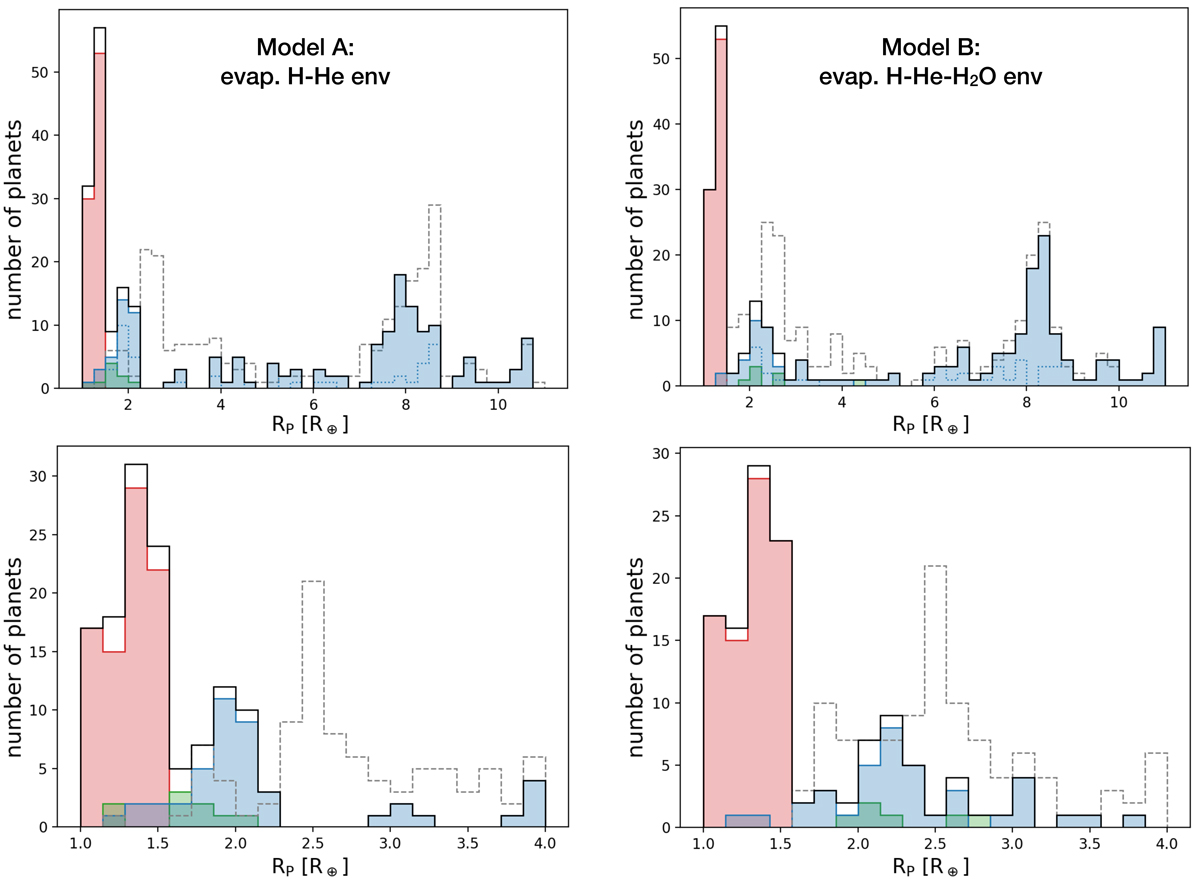
Radius histogram of the synthetic planets with P ≤ 100 days, after computing the cooling during 5 Gyr with mass-loss driven by evaporation (solid lines). The dashed grey lines show the overall distribution when evaporation is neglected. Top panels: all the populations. Lower panels: zoom in on radius between that of Earth and Neptune. Left panels: model A (evaporation of H-He envelopes). Right panels: model B (evaporation of H-He-H2O envelopes). Red, blue, and green indicate different initial water core fractions as in Fig. 3, and black lines the overall distributions. The blue dotted line in the upper panels shows water-rich planets born in discs of α = 10−3 (the remaining cases correspond to α = 10−4).
Current usage metrics show cumulative count of Article Views (full-text article views including HTML views, PDF and ePub downloads, according to the available data) and Abstracts Views on Vision4Press platform.
Data correspond to usage on the plateform after 2015. The current usage metrics is available 48-96 hours after online publication and is updated daily on week days.
Initial download of the metrics may take a while.